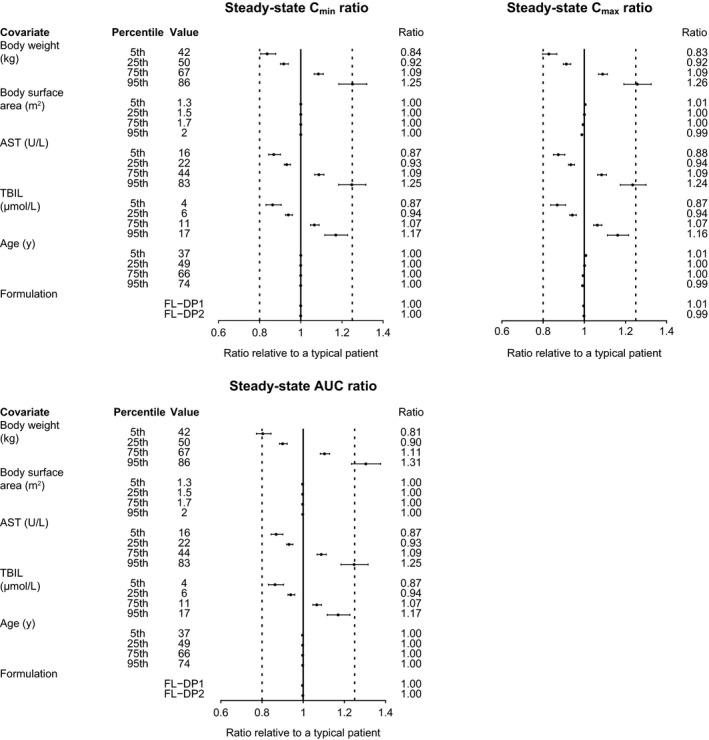
Figure 5.

Forest plot of covariate effects on released‐drug exposure. Note: First and second dashed vertical lines correspond to ratios of 0.8 and 1.25, respectively. The solid vertical line corresponds to a ratio of 1 and represents the typical patient. Points and whiskers represent the estimate and 90% CI, respectively. A typical patient is defined as a 57‐year‐old female with body weight 57.8 kg, TBIL 8 μM, and AST 30 U/L and who was administered the Lyo‐DP formulation of T‐DXd. Covariate effects of ritonavir or itraconazole coadministration are not presented because they were assessed in the dedicated drug–drug interaction study (Study A104; N = 40). Ten cycles were simulated to represent steady‐state profiles. AST, aspartate aminotransferase; AUC, area under the concentration‐time curve; CI, confidence interval; Cmax, maximum concentration; Cmin, minimum concentration; FL‐DP1, frozen liquid drug product 1; FL‐DP2, frozen liquid drug product 2; Lyo‐DP, lyophilized powder drug product; TBIL, total bilirubin; T‐DXd, trastuzumab deruxtecan.
