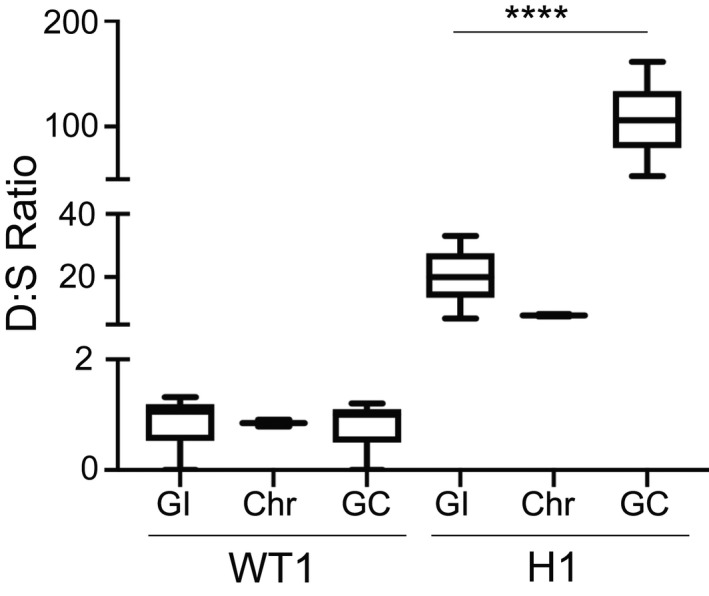
FIGURE 4.

Droplet Digital PCR shows the enrichment of the resistance gene in extrachromosomal DNA. Following PFGE (as in Figure 2b), specific regions of the agarose gel were excised, DNA was purified, and assessed by Droplet Digital (dd)PCR for specific genomic loci. PFGE gel regions included the loading well with gel‐incompetent DNA (GI), the chromosomal (Chr) region with megabase‐sized chromosomes 1–14, and the lowest region that harbors gel‐competent DNA (GC) that runs between 50 and 200 kb. D:S Ratio, dihydroorotate dehydrogenase gene copies (dhodh,denoted as D, the resistance gene contained within the amplicon) divided by single copy gene copies (from chromosome 11, denoted as S, Table 1), as quantified by the Quantasoft software. The average D:S ratio measured in the WT1‐GI, Chr, and GC regions are 1.1, 0.9, and 1.0, respectively. The average D:S ratio (line in the center of the box) measured in the H1‐GI, Chr, and GC regions are 20, 7.9, and 106, respectively. Expecteddhodhamplicon copy numbers for different clones are shown in Figure 1. ****p < .0001. Error bars represent Poisson confidence intervals (upper hinge, 75th percentile; lower hinge, 25th percentile);N = 3 per group
