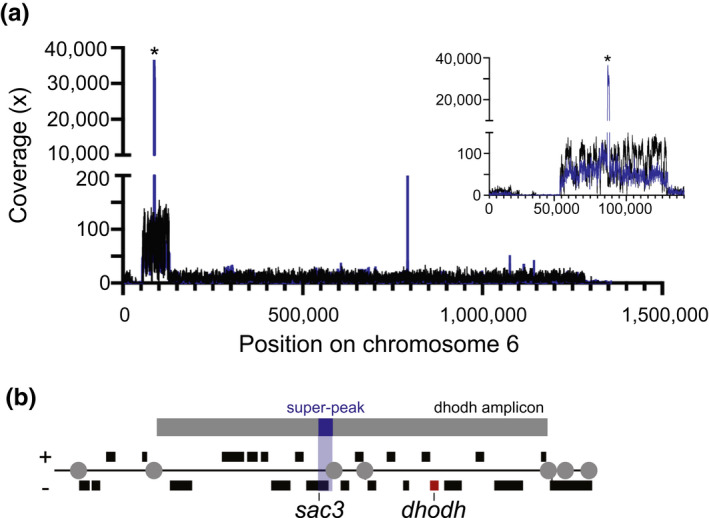
FIGURE 6.

Deep sequencing shows conservation of amplicon boundaries and ecDNA‐specific sequence. Following PFGE (as in Figure 2b), the loading well was excised from WT1 (Dd2) and the highly resistant H1 clone (containing gel‐incompetent DNA), DNA was purified, amplified, and sequenced on the Illumina MiSeq platform. H1 gDNA and was also sequenced for comparison. (a) Read coverage across chromosome 6 from H1 gDNA (black line) and H1 gel‐incompetent DNA (blue line) was visualized using Integrative Genomics Viewer Software (IGV 2.4.10). Right inset, zoom of thedhodhamplicon. *Dramatic overrepresentation of a <1 kb region partially spanning thesac3 gene(PlasmoDB ID: PF3D7_0602600) in the H1 gel‐incompetent sample (termed super‐peak due >30,000‐fold coverage, Table S4). (b) The relative gene locations (black boxes) and the super‐peak location (blue shaded region) within the fulldhodhamplicon (gray box, top) adapted from (Guler et al.,2013). Red box,dhodhgene; gray circles, location of long A/T tracks involved in CNV formation; black boxes, genes with ±orientation
