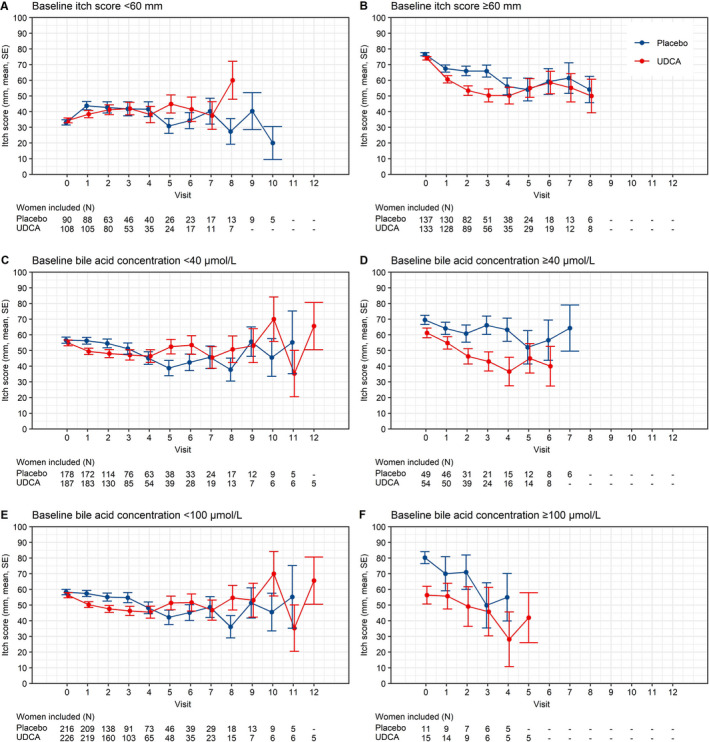
Figure 2.

Itch score mean trajectories stratified by baseline characteristics. Changes in itch score by visit post‐randomisation, stratified by baseline itch score (A and B: <60 mm versus ≥60 mm) and by bile acid concentration (C and D: <40 μmol/l versus ≥40 μmol/l, E and F: <100 μmol/l versus ≥100 μmol/l). Numbers below each graph refer to number of women contributing results at each point. Only visits with five or more women were included. Visit 0 = baseline visit. GM = geometric mean, SE = standard error.
