
FIGURE 2.
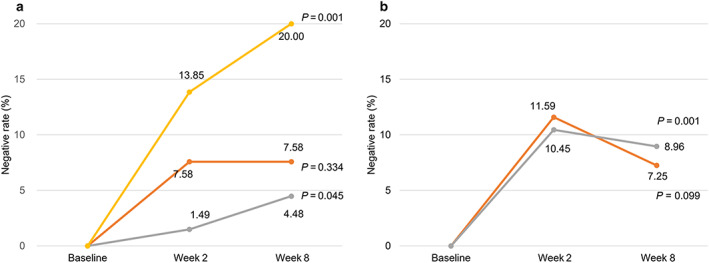
Temporal trends of Helicobacter pylori suppression rates in each active intervention group in the per‐protocol datasets. (a) Juice arm.  , J‐B;
  , J‐C;
  , J‐D. (b) Powder arm. ;
  , P‐B;
  , P‐C. *Temporal trends were determined by Fisher's exact test. [Color figure can be viewed at wileyonlinelibrary.com]