
Figure 2.
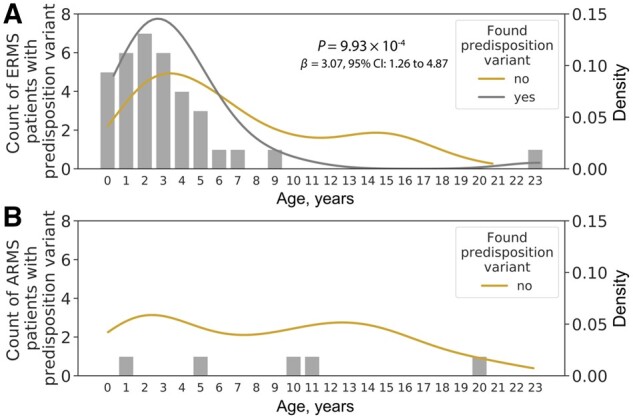
Age distribution of patients with and without a predisposition variant. Bar plots indicate the number of patients with a predisposition variant. (A) Age density among embryonal rhabdomyosarcoma (ERMS) patients with (grey) and without (golden) a predisposition variant. The P value was calculated from a linear regression model using age at diagnosis as the independent variable. (B) Age density among alveolar rhabdomyosarcoma (ARMS) patients without a pathogenic variant (golden). Density plot for ARMS patients who have predisposition variants (n = 5) was not generated due to the small patient count.