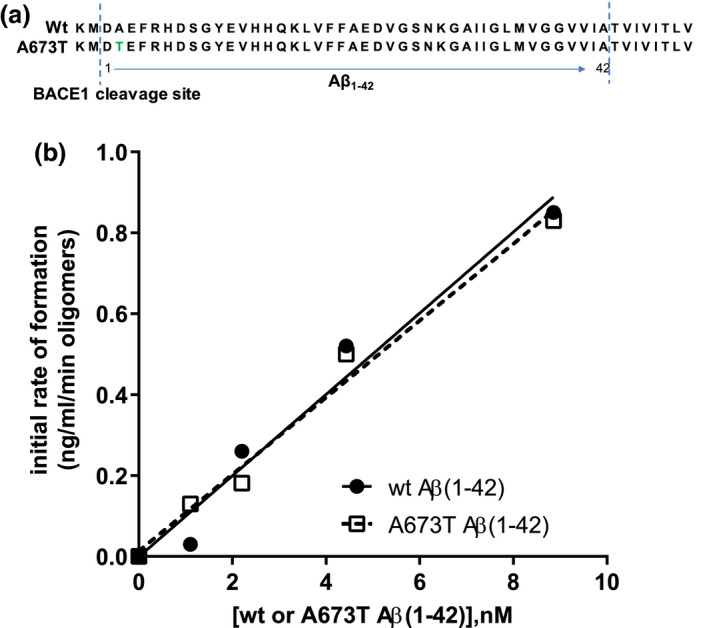
FIGURE 1.

Wt and A673T mutant Aβ(1‐42) oligomers exhibit similar initial rates of assembly. Sequences of wt and mutant Aβ proteins illustrate the A to T substitution at position 2 relative to the β‐secretase cleavage site (a). Assembly of a range of concentrations of wt and A673T mutant Aβ(1‐42) monomeric proteins into oligomers was monitored over time (b). Oligomer content was determined by single‐site binding ELISA after oligomerization was halted by addition of Tween‐20. The slope of the assembly rate of oligomers over the initial 5 min (0, 1, 2, 5 min) was calculated via linear regression. No detectable difference between wt and A673T mutant proteins in initial rate of oligomer formation was observed (linear regression for slope difference, p = .67, F = .195). Dashed and solid lines represent linear regression fits to the data points. Results were obtained from N = 2 independent ELISA experiments (technical replicates)
