
FIGURE 6.
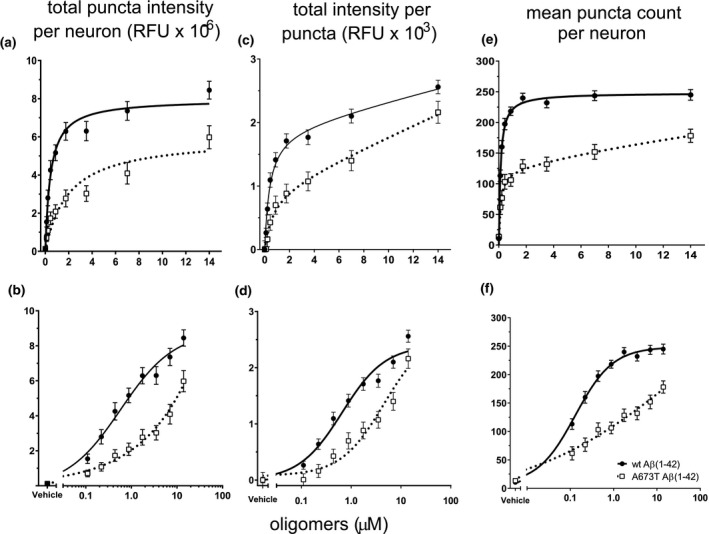
A673T Aβ(1‐42) oligomers bind less, and with lower affinity as well as intensity, to synaptic puncta than wt Aβ(1‐42) oligomers. Synthetic wt Aβ(1‐42) protein and A673T Aβ(1‐42) oligomers were added to rat neuronal cultures for 60 min at 37°C at total Aβ concentrations ranging from 0.88 to 14 μM. Oligomer binding to synaptic puncta was visualized via quantitative immunofluorescence. (a) At equivalent protein concentrations, wt Aβ(1‐42) produced a 3‐fold higher total binding intensity than A673T. (b) Data from (a) displayed on a logarithmic scale to emphasize the difference in binding affinity (wt Aβ(1‐42) = 442 ± 70 nM and A673T mutant = 1,950 ± 732 nM, one‐site specific binding least squares fit model, p < .001). (c) Mean intensity per puncta shows brighter intensity at each concentration for wt oligomer when compared to A673T mutant oligomer on a linear scale. (d) Data from (c) displayed on a logarithmic scale (one‐site specific binding least squares fit model, p < .001). (e) Number of binding puncta per neuron graphed on linear and (f) logarithmic scales show that wt Aβ bound to more puncta at each concentration compared to A673T mutant (one‐site specific binding least squares fit model, p < .001). Wt Aβ(1‐42) oligomers and A673T mutant oligomers are represented by circles with solid lines and open squares with dotted lines, respectively. All data represent mean ± SEM from N = 16 independent neuronal culture experiments. Y‐axis labels are shown at the top of each column of data