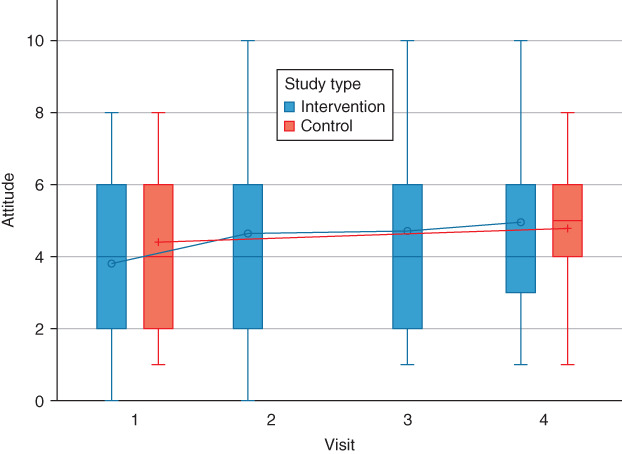
Figure 2.

Distributions of knowledge scores at each time point in the intervention and control groups. [Color figure can be viewed at wileyonlinelibrary.com]

Distributions of knowledge scores at each time point in the intervention and control groups. [Color figure can be viewed at wileyonlinelibrary.com]