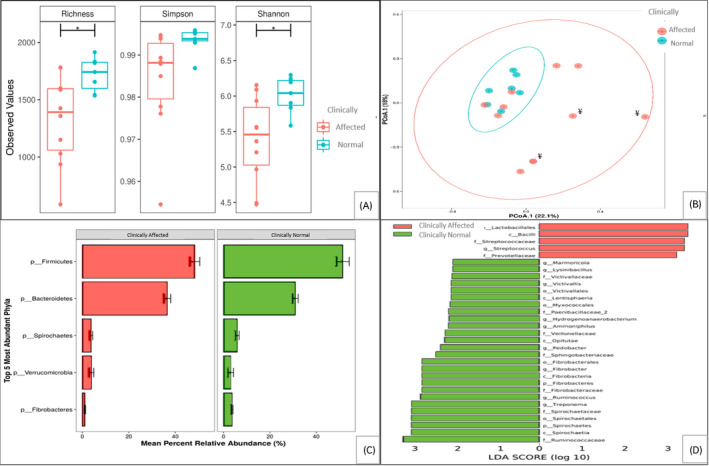
Figure 2.

Faecal microbiota characteristics in horses from the study group where sampling was carried out at first presentation of clinical signs (n = 10), or which were only clinically normal/developed clinical signs later in the outbreak after faecal microbiota analysis (n = 7). (A) Alpha‐diversity measurements of faecal microbiota by Richness, Simpson and Shannon indices (B) Beta‐diversity measurements of faecal microbiota by PCoA. ¥ denotes horses who received antibiotic and anthelmintic treatment one day prior to sampling (C) Relative abundance of faecal microbiota. Phyla are displayed as mean percent relative abundance. (D) Comparison of the two groups by linear discriminant analysis (LDA) effect size (LEfSe) algorithm. Note: sampling was not done on the two horses who were euthanised and two horses that were mild and transiently affected. Significant differences are indicated: *p < 0.05. For (B) P = 0.015
