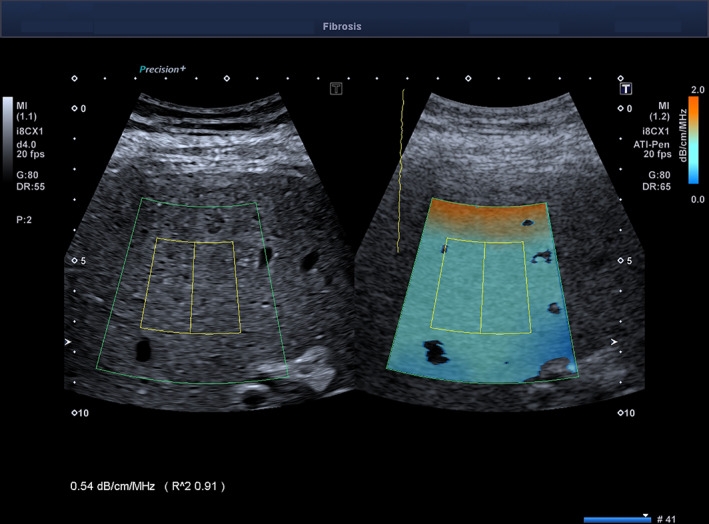
Figure 3.

Assessment of liver steatosis with ATI‐Pen. A thick orange line, due to a reverberation artifact, is shown in the near field. In the far field, there are 2 dark‐blue areas, likely due to high noise with a weak echo signal. These areas must not be included in the measurement box: ie, the yellow rectangle inside the region of interest. The R 2 value is 0.91; therefore, the measurement is reliable.
