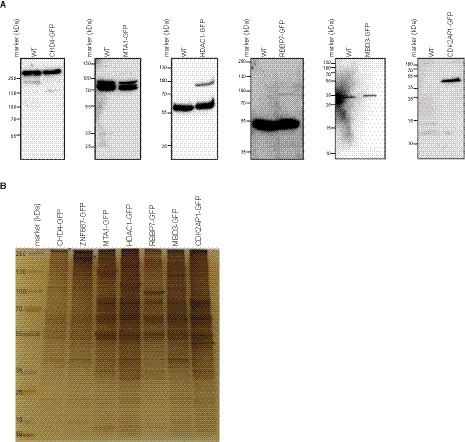
Fig. 1.

Expression analysis of the used cell lines. (A) Western blot analysis of 6 cell lines shows that the tagged proteins are expressed at much lower levels than the endogenous protein. The exception is CDK2AP1. Black triangle indicates the endogenous, untagged protein, while asterisk indicates the tagged protein (n = 1). (B) Silver‐stained gel to visualize the homogeneity of the purifications of NuRD via different bait proteins (n = 1). Asterisks indicate the tagged proteins.
