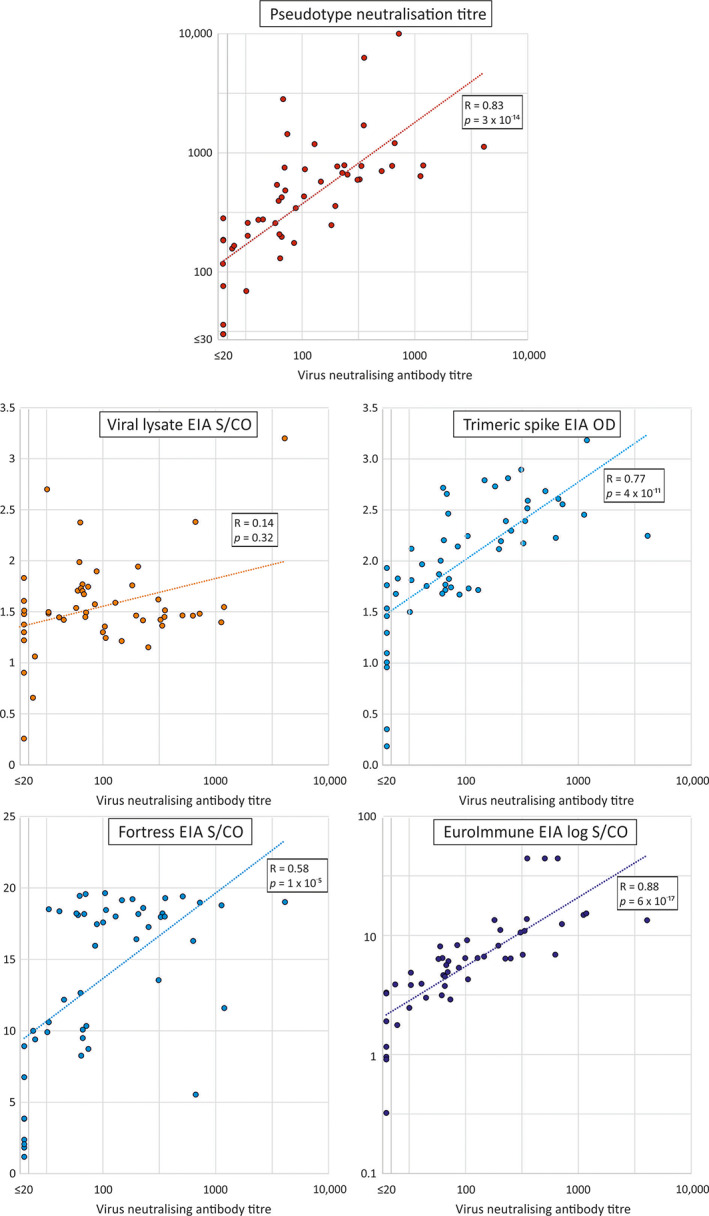
FIGURE 2.

Correlations between neutralising and pseudo‐type antibody titres and reactivities in EIAs. Scatter plots of neutralising antibody titres of test samples in the virus neutralisation assay with those of the pseudo‐type assay and reactivities in EIAs. A line of best fit was estimated by linear regression using log‐transformed values for the virus and pseudo‐type neutralising antibody assays and the EUROimmun EIA. Correlation coefficients and (two‐tailed) p values were calculated by Spearman non‐parametric test [Color figure can be viewed at wileyonlinelibrary.com]
