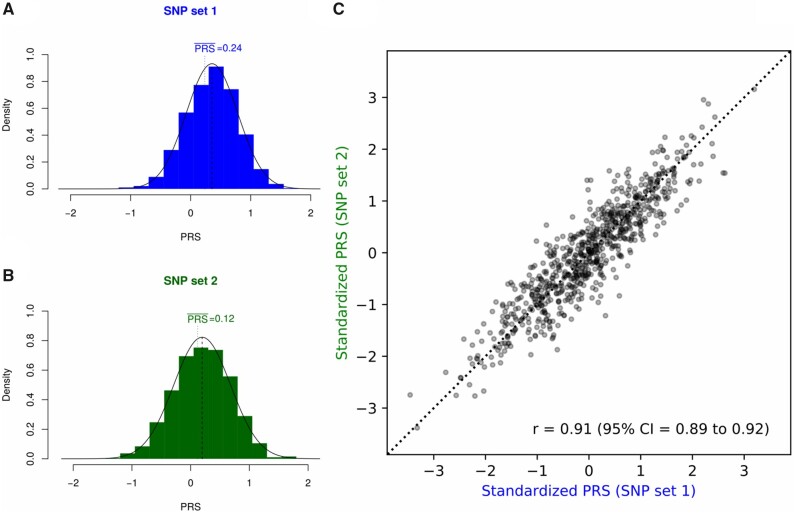
Figure 1.
Empirical distributions of the polygenic risk score (PRS) for single nucleotide polymorphism (SNP) set 1 (A) and SNP set 2 (B) in the overall cohort of 760 CHEK2 mutation carriers. Values of theoretically expected mean are indicated with vertical lines. (C) Standardized PRS values per individual for SNP set 1 and SNP set 2.

