FIGURE 7.

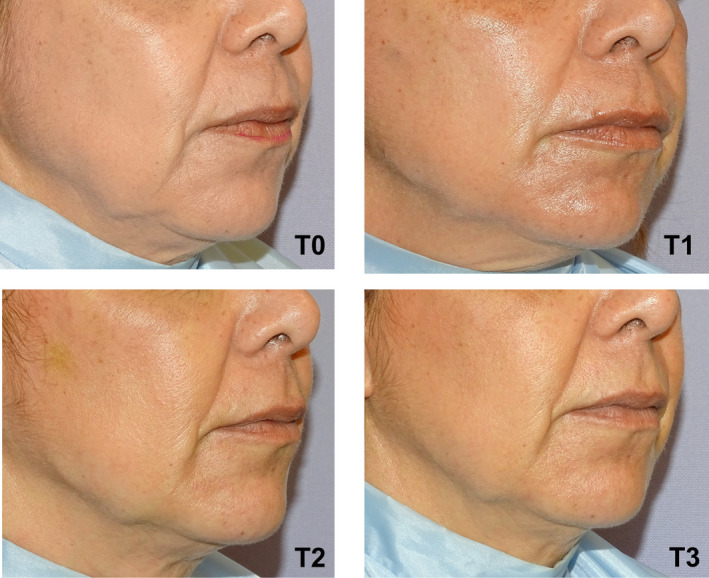
Right oblique projection of a patient face before and after being treated with VYC‐25L®. T0: Before treatment. T1: Immediately after treatment. T2: At 48 hours after treatment administration. T3: 30 days after treatment administration

Right oblique projection of a patient face before and after being treated with VYC‐25L®. T0: Before treatment. T1: Immediately after treatment. T2: At 48 hours after treatment administration. T3: 30 days after treatment administration