FIGURE 2.

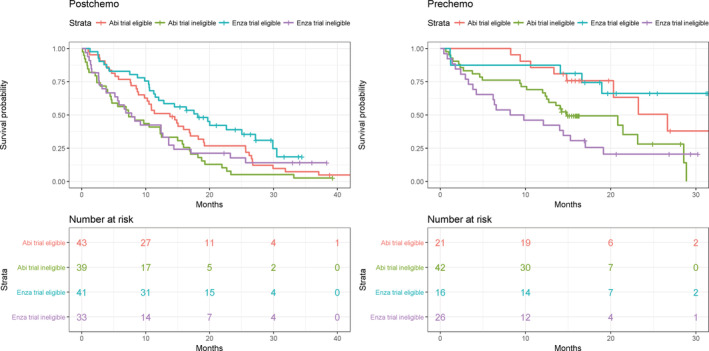
Kaplan‐Meier survival curves, by indication (post and pre chemotherapy) and stratified by medicine and trial eligibility

Kaplan‐Meier survival curves, by indication (post and pre chemotherapy) and stratified by medicine and trial eligibility