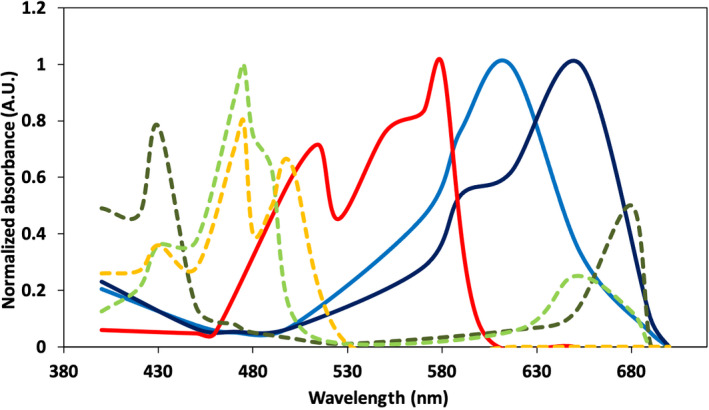
FIGURE 3.

Normalized absorption spectra (in Arbitrary Units [A.U.]) of eukaryotic pigments (dashed lines): Chl a (dark green), Chl b (pale green), carotenoids (orange) and prokaryotic pigments (solid lines): Phycoerythrin (red), Phycocyanin (light blue), Allophycocyanin (dark blue)
