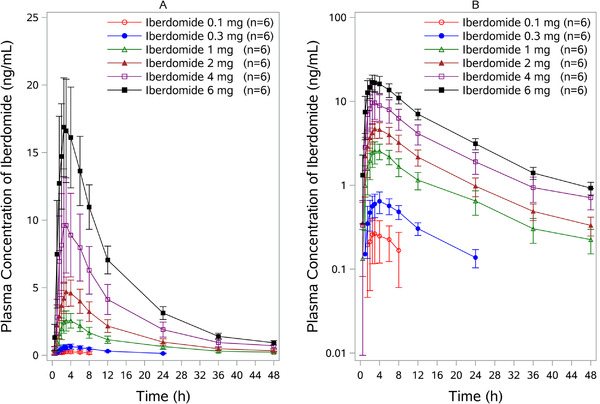
Figure 1.

Iberdomide plasma concentration‐time profile following administration of single oral dose in healthy subjects. Both linear (A) and semilogarithmic (B) scales are shown. Results from the 0.03‐mg dose are not included bcause all concentrations at this dose were below detectable levels. Data are mean ± SD. SD, standard deviation.
