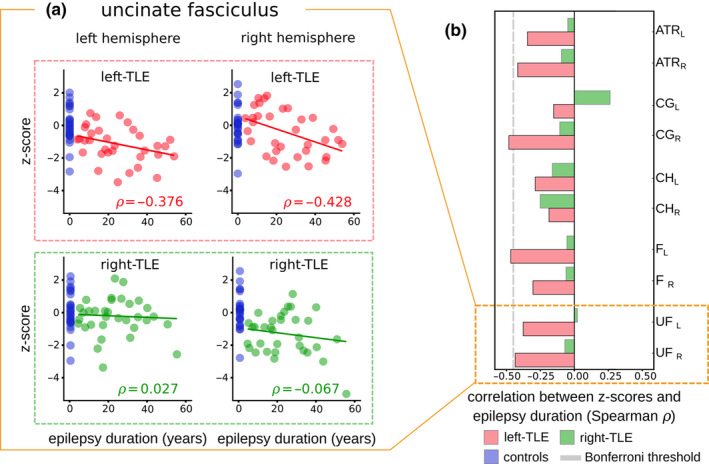
FIGURE 3.

Univariate associations with epilepsy duration for all ten white matter tracts. (a) Scatter points showing individual subjects and their corresponding z‐scores and epilepsy duration values in the bilateral uncinate fasciculus. Left‐TLE patients (upper panels) are analysed independently to the right‐TLE patients (lower panels). Blue datapoints represent individual control subjects. Inset (b) summarises associations with epilepsy duration in all ten white matter tracts for both patient groups. Grey dashed line represents the significance threshold after applying the Bonferroni multiple comparisons correction (⍴ = −0.44). No significant association with duration is present for any tract in right TLE patients. ATR: Anterior thalamic radiation, CG: Cingulum gyrus, CH: Cingulum hippocampus, F: Fornix, UF: Uncinate Fasciculus. L and R correspond to the left and right hemisphere respectively
