
Fig. 4.
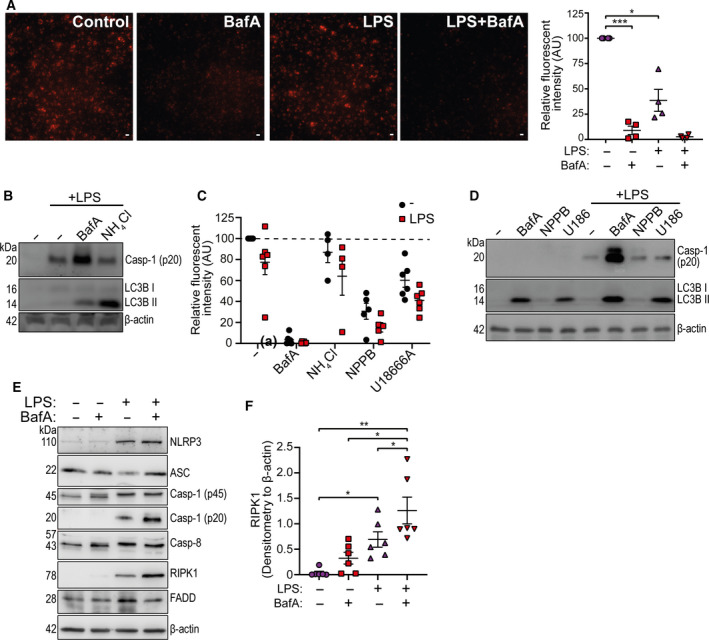
The effects of V‐ATPase inhibition on NLRP3 are independent of lysosomal pH. (A) Representative images and relative fluorescent intensity quantification (emission at 620 nm) from CD14 + monocytes treated with LPS (1 µg·mL−1) or bafilomycin A1 (BafA, 100 nm) in the presence of 10 µg·mL−1 DQ‐BSA Red for 18 h (Scale bar 25 µm, n = 4). (B) Western blot of mature caspase‐1 (p20), lipidated LC3B, and β‐actin from CD14+ monocyte total cell lysate stimulated with LPS (1 µg·mL−1) plus BafA (100 nm) or NH4Cl (5 mm) for 18 h (n = 4). (C) Relative fluorescence intensity of CD14+ monocytes treated with or without LPS plus NH4Cl (5 mm), NPPB (50 μm), U18666A (20 μm) in the presence of 10 µg·mL−1 DQ‐BSA Red for 18 h (n = 6). (D) Western blot of mature caspase‐1 (p20), lipidated LC3B, and β‐actin from CD14 + monocyte total cell lysate stimulated with BafA (100 nm), NPPB (50 μm) or U18666A (U186, 20 μm) for 18 h (n = 3). (E) Western blot of NLRP3, ASC, pro‐caspase‐1 (p45), mature caspase‐1 (p20), caspase‐8, RIPK1 and FADD from CD14+ monocyte total cell lysate stimulated with LPS (1 µg·mL−1) plus and minus BafA (100 nm) for 18h (n = 6). (F) Densitometry of RIPK1 in samples stimulated as shown in (E) (n = 6). *P < 0.05, **P < 0.01, ***P < 0.001 was determined using one‐sample t test versus hypothetical value of 100% (in A,C) or by a one‐way ANOVA with Sidak’s post hoc comparison (F). Values shown are the mean ± SEM.