
Figure 3.
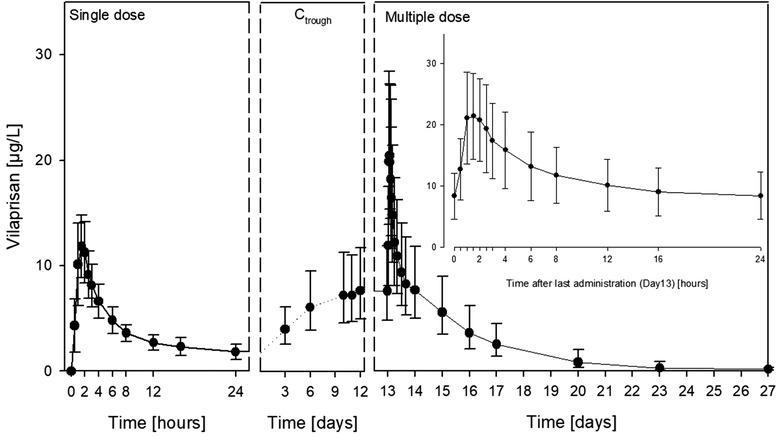
Plasma concentrations vs time curves of vilaprisan obtained after single‐ (day 1) and multiple‐dose (day 14) administrations of 2 mg of vilaprisan as well as trough concentrations obtained 3 to 12 days after first administration (N = 11). Data are presented as arithmetic mean and standard deviations. Ctrough, plasma trough concentration.