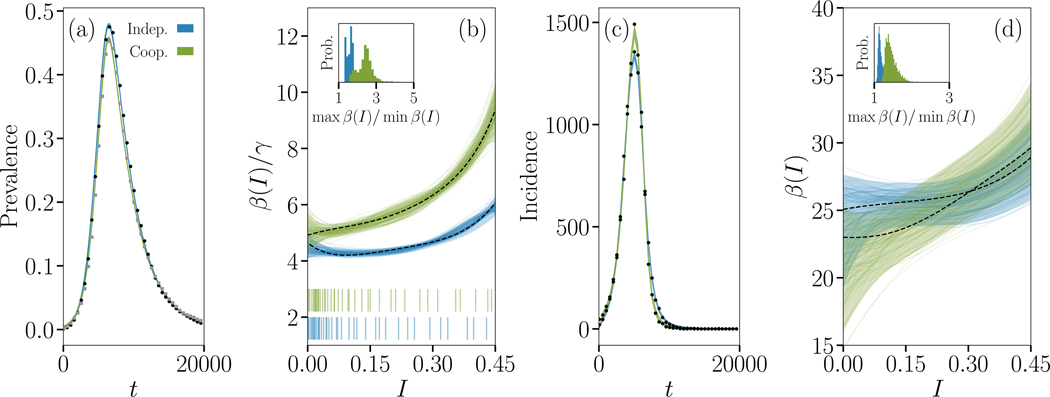
FIG. 3. Signature of non-interacting and interacting SIR epidemics.
We simulate the Susceptible-Infectious-Recovered (SIR) process in the case of non-interacting and interacting simple contagions on clustered contact networks where each of 10,000 individuals belongs to 2 cliques of size 5. (a) Dynamics of the density of infected individuals for epidemics taking place on the same networks, and (c) corresponding incidence time series. Parameters were chosen to produce roughly similar time series. In one case (blue data), two diseases with transmission rate 3/10 and recovery rate 1/3 spread without interaction, and we show the evolution of only one of them. In the other case (green data), two diseases with transmission rate 1/10 and recovery rate 1 interact positively by increasing their transmission rate by a factor of 7 whenever the other disease occurs on the same contact and decreasing their recovery rate by the same factor when an individual is co-infected. We again show the evolution of only one of the two diseases. The coloured curves are Bayesian fits of a continuous model of complex contagion in a well-mixed population;51 the simulated time series are shown with small closed symbols. (b) Inferred complex contagion function β(I)/γ for the two series from prevalence data, with the density of observation illustrated with bar plots below. The maximum a posteriori fit is shown with a dotted line, alongside with the 5th to 95th percentiles (shaded region), and 100 randomly selected posterior samples (coloured transparent lines) that highlight the samples-to-samples variability. The insets describe how close the inferred transmission functions are to a flat transmission rate by plotting the distribution of the ratio of the maximal to minimal values in the posterior samples. In both cases, the transmission functions inferred on the time series of interacting contagions are significantly different from the transmission functions inferred on non-interacting contagion data. (d) Same inference, but from incidence data.

