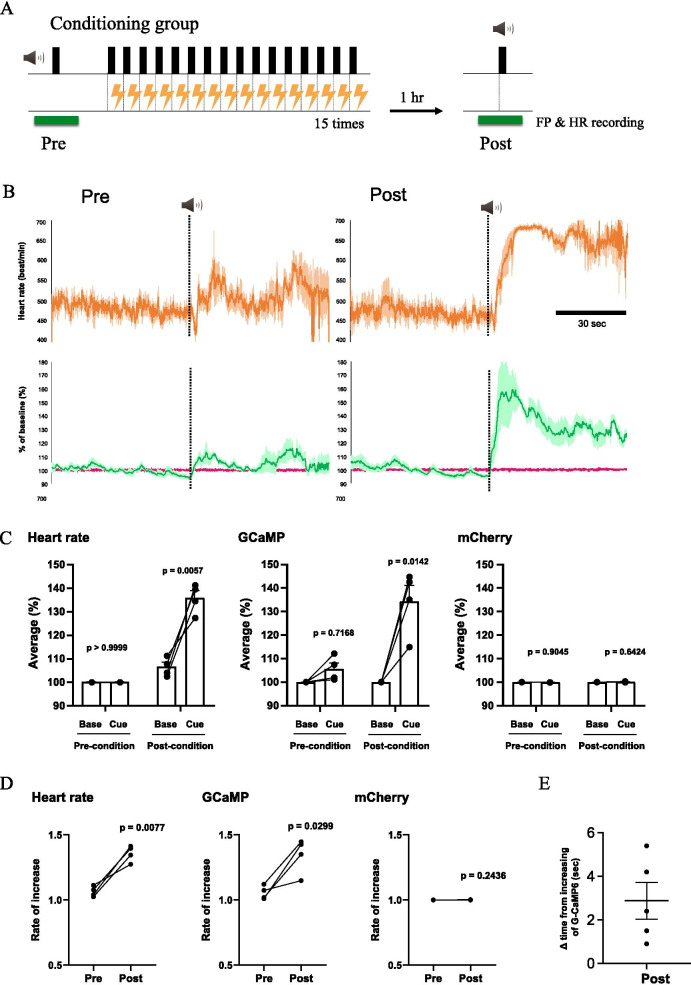
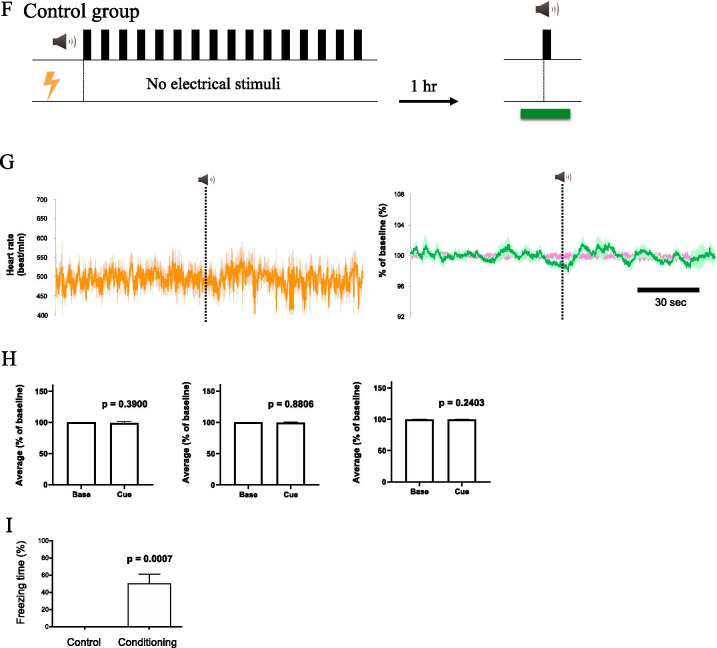
Fig. 4.
Conditioning-induced activation of orexin neuron and increase in heart rate without aversive sensory input. A Experimental design for neuronal and heart rate recordings of conditioning group (n = 4). Heart rate (HR) and fluorescence via fiber photometry (FP) were recorded for 2 min around sound application before conditioning (pre) and 1 h after conditioning (post). HR and fluorescence were averaged for 1 min during the baseline period and after the cue sound (green horizontal line). B Traces of the heart rate (upper), G-CaMP6 and mCherry fluorescence (lower) in pre-conditioning (left) and post-conditioning (right) in the conditioning group. The dark-colored line indicates the averaged value and the light-colored line shows SEM. C Grouped average and SEM of the averaged values for 1 min during the baseline period and after the cue sound. Two-way ANOVA revealed that there was significant difference between baseline and cue sound (Heart rate: F(1, 3) = 8.719, P = 0.0599; G-CaMP6: F(1,3) = 15.22, P = 0.0299; mCherry: F(1,3) = 2.096, P = 0.2435) and between pre-condition and post-condition (Heart rate: F(1, 3) = 622.9, P < 0.0001; G-CaMP6: F(1,3) = 30.91, P = 0.0115; mCherry: F(1,3) = 0.04808, P = 0.8405). P values in the figure were calculated by Bonferroni’s multiple comparison test. D Changes in the rate of increase due to the cue sound of individual mice. The rate of increase is represented by the average of after cue sound/the average of before cue sound. P values were calculated using a paired t-test. E The difference between the onset of fluorescence change and the onset of heart rate change. See Fig. 3A for the definition of ∆time. F Experimental design for neuronal and heart rate recordings in the control group (n = 11). G Traces of the heart rate (left), G-CaMP6 and mCherry fluorescence (right) in the control group. H Grouped average and SEM of the averaged values for 1 min during the baseline period and after the cue sound. P-values were calculated using paired t-test. I Results of the freezing score (% time) during cue test tone. In the post-session, freezing behavior was counted in the control group (n = 11) and in the conditioned group (n = 4). P-values were calculated using Mann–Whitney’s nonparametric test


