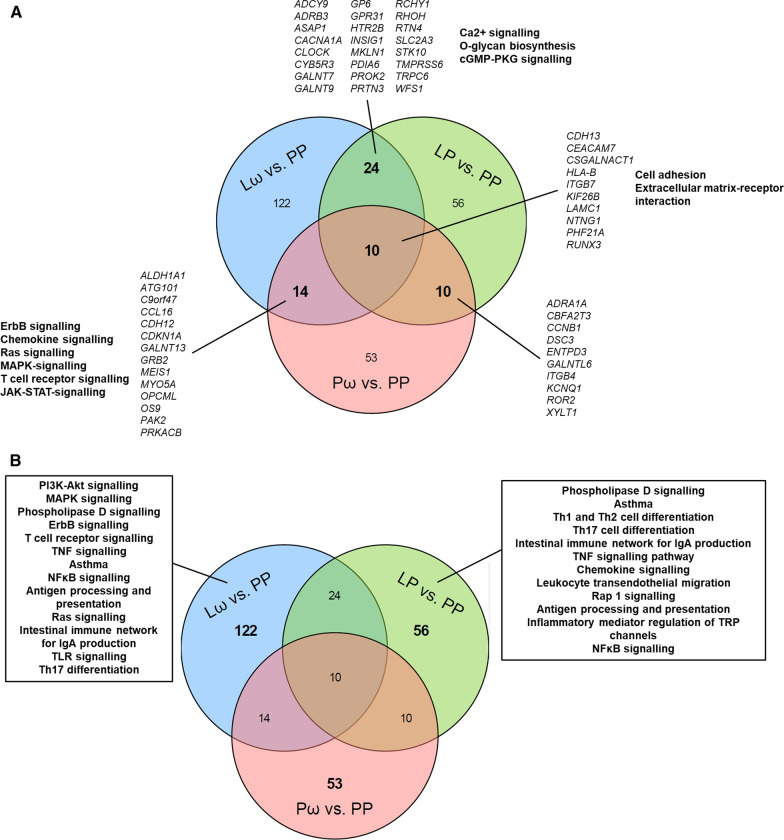
Fig. 4.
Venn diagrams illustrating the degree of overlap and uniqueness for the obtained genes from the three network modules for the double active treatment (Lω vs. PP) and the single active treatment (LP vs. PP, Pω vs. PP) comparisons. In A the number of common genes from the overlap are displayed for each comparison is shown, with corresponding gene names denoted in italics, and selection of related pathways in bold. No relevant pathways were revealed for the shared genes of the LP vs. PP and Pω vs. PP comparisons. In B the number of genes that are unique for each comparison are displayed along with a selection of corresponding related pathways. No pathways of relevance were revealed for the unique genes from the Pω vs. PP comparison. L—Lactobacillus reuteri, ω—ω-3 fatty acids, P—placebo

