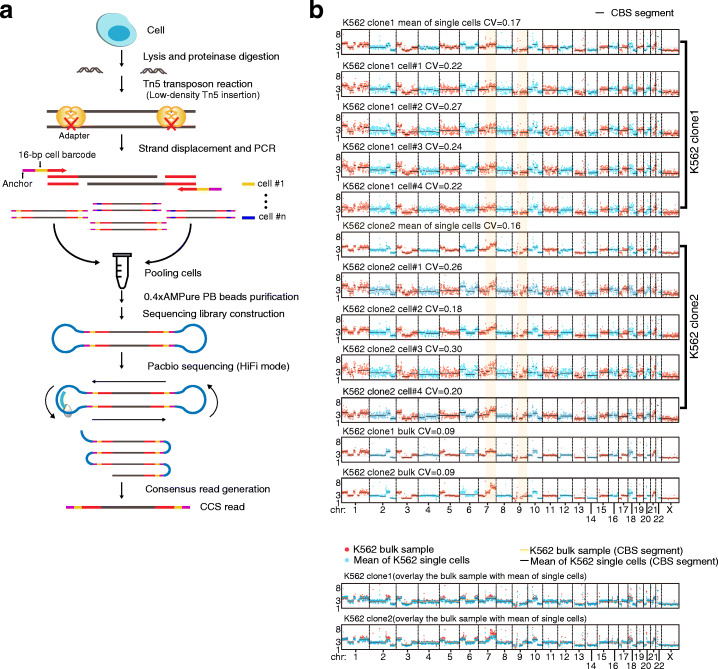
Fig. 1.
Schematic of SMOOTH-seq and CNV detection. a The schematic of SMOOTH-seq. After cell lysis and proteinase digestion, genomic DNA from a single cell is randomly fragmented by low-density Tn5 transposon insertion. Then, the produced fragments undergo strand displacement and amplification using 16bp-barcoded primers. Next, the amplified single cell gDNAs of different barcodes are pooled together and purified to prepare sequencing libraries. The libraries were sequenced on Pacbio Sequel II System using HiFi mode and the CCS reads are harvested for analyzing. b CNVs of single K562 cells showing in 1Mb windows (CV for each cell using bulk K562 copy number as the baseline). Digitized copy numbers across the genome are plotted in representative single K562 cells from clone 1 and clone 2 as well as the bulk samples of the two clones. The mean copy numbers are the averages of 44 cells from clone 1 and 47 cells from clone 2, respectively. The yellow shadow highlights the differences of CNVs on the long arm of chromosomes 7 and 9 between these two clones. At the bottom of pannel, the mean CNV values of K562 single cells to the CNV values of K562 bulk samples are plotted

