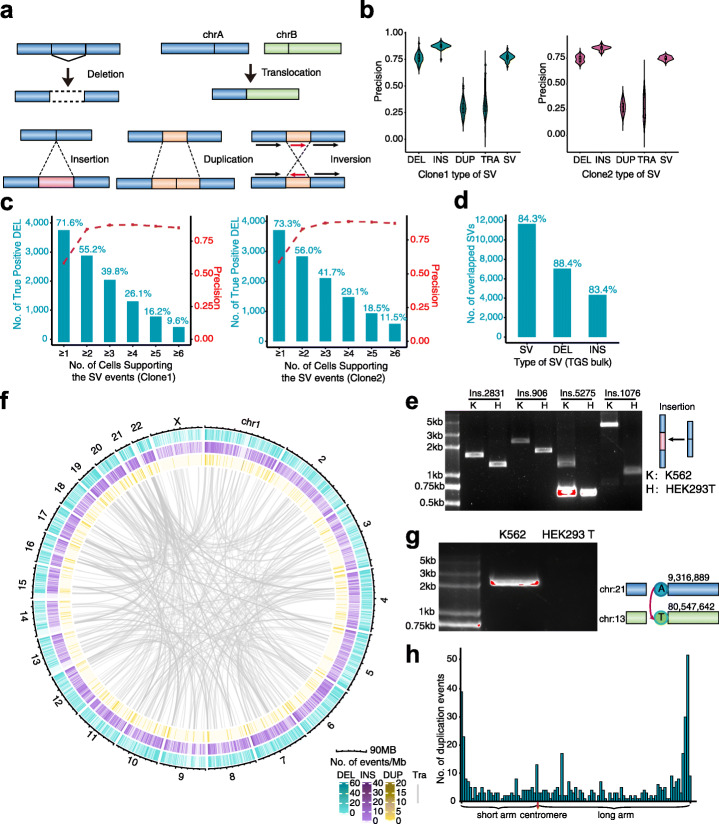
Fig. 2.
SV detection using SMOOTH-seq. a The diagram of insertions, deletions, duplications, and translocations and inversions. b Precision of SMOOTH-seq detecting SVs in clone 1 or clone 2 K562 cells. DEL, deletion. INS, insertion. DUP, duplication. TRA, translocation. c Precision of SMOOTH-seq detecting deletions and the percentage of true positive deletions with different numbers of supporting clone 1 or clone 2 K562 cells. d Overlapping of deletions and insertions detected by TGS bulk in clone 1 and clone 2. e PCR validation of 4 insertion events identified in K562 cells but not HEK293T cells by SMOOTH-seq. Ins, insertion. K, K562. H, HEK293T. ins.2831 represents insertions happened at chr17:57,539,630-57,539,631, ins.906 happened at chr14:31,993,906-31,993,907, ins.5275 happened at chr6:1,250,735-1,250,736, and ins.1076 happened at chr18:49,810,930-49,810,931. f A comprehensive overview of SVs detected by SMOOTH-seq in single K562 cells (shinyCircos was used for figure plotting [27]). g PCR validation of a translocation event in K562 cells but not HEK293T cells. The diagram on the right indicates the detailed positions and directions of the translocation. h Distribution of duplication events on the chromosomes. The chromosomes are separated into 100 windows from the centromere to the telomere. The number of duplication events are calculated in each window. The uniform distribution test was conducted and the P-value was less than 1×10⁻³

