Fig. 3.
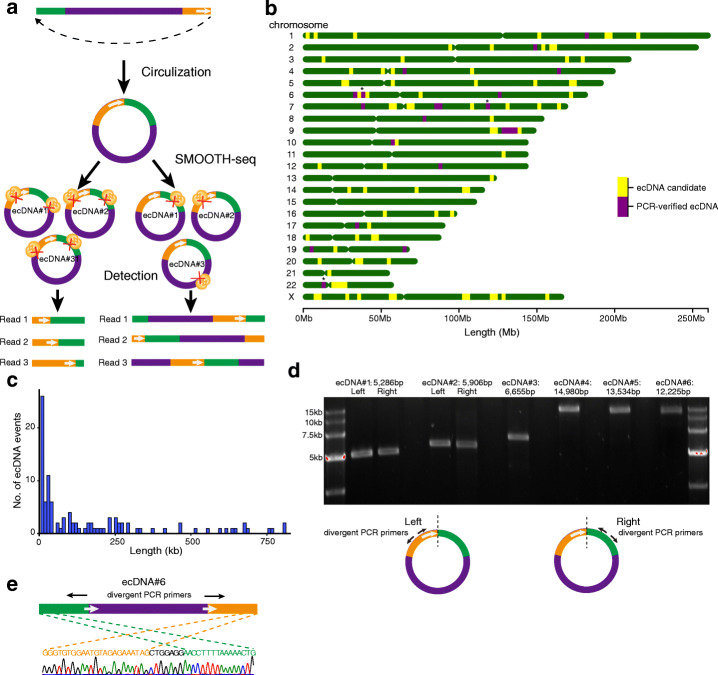
ecDNA detection in K562 cells. a Diagram showing the detection of ecDNAs by SMOOTH-seq. The green part and orange part show the flanking regions of the circulation sites. The Tn5 transposases bind on an ecDNA molecule, generates linear fragments spanning the circulation site. When only one copy of Tn5 transposases inserts into an ecDNA, it will produce linearized read sequence of the full ecDNA length. b The location distribution of candidate ecDNAs (yellow) and PCR verified ecDNAs (purple) on the chromosomes (R package chromoMap v0.2 was used for figure plotting). The stars indicate regional overlap of both unvalidated and validated ecDNAs. c The length distribution of ecDNAs (125 in total) detected in K562 cells. d Validation of six ecDNAs in K562 cells by full-length PCR using divergent primers as indicated in the bottom. ecDNA#1 represents chr8: 70,427,292-70,432,578, ecDNA#2 represents chr6:117,278,014-117,283,920, ecDNA#3 represents chr19:4,218,299-4,224,954, ecDNA#4 represents chr19:58,198,975-58,213,955, ecDNA#5 represents chr2:140,078,412-140,091,946, ecDNA#6 represents chr6:35,786,783-35,799,008. e Sanger sequencing result of the circularization site of ecDNA#6 in panel d

