
Fig. 4.
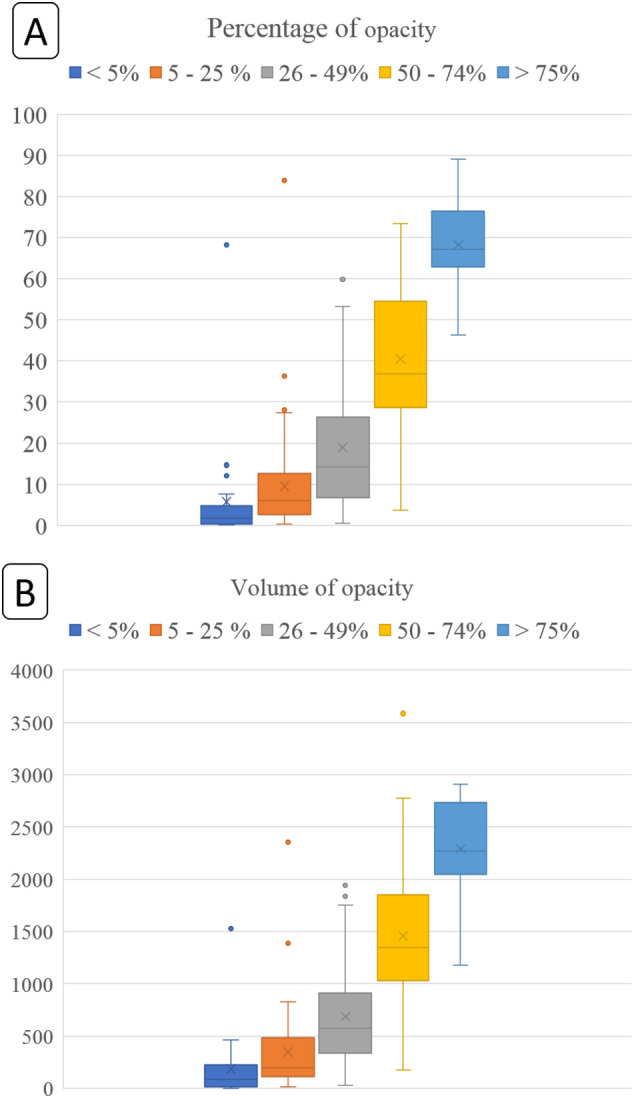
Box whisker plots for percentage (A) (top graph: y-axis denotes percentage of lung affected by opacities) and volume of opacities (B) (bottom graph: y-axis denotes absolute lung volume affected by opacities in mL). The different color boxes along the x-axis represent subjective severity assessment into different subjective percentage categories of lungs affected by opacities. The horizontal lines within each box represent median values whereas the upper and lower bounds of each box are first and third quartiles. The whiskers denote minimum and maximum values. The cross marks (x) represent the average values.