. 2021 Feb 19;23(10):5984–5991. doi: 10.1039/d0cp06452a

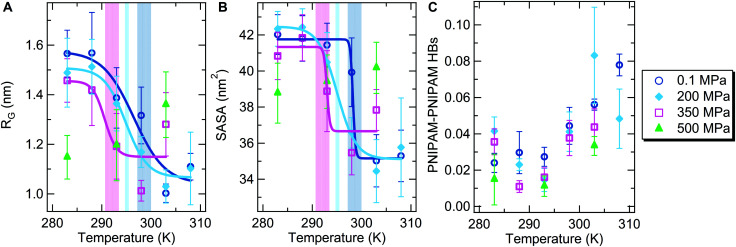
Fig. 1. Temperature dependence of (A) the PNIPAM radius of gyration; (B) the solvent accessible surface area. Data represent time averaged values over the last 100 ns and standard deviation. Solid lines are the sigmoidal fit. The transition temperature values, equal to 298.5 ± 1.5 K, 295.0 ± 0.5 K, and 292.0 ± 1.5 K at 0.1 MPa, 200 MPa, and 350 MPa, respectively, are identified by vertical bands including error bars. (C) Temperature dependence of the total number of PNIPAM–PNIPAM hydrogen bonds normalized to the number of repeating units. Data calculated at pressure values of 0.1, 200, 350 and 500 MPa are shown with blue circles, light blue diamonds, pink squares and green triangles, respectively.

Fig. 1