. 2021 Feb 19;23(10):5984–5991. doi: 10.1039/d0cp06452a

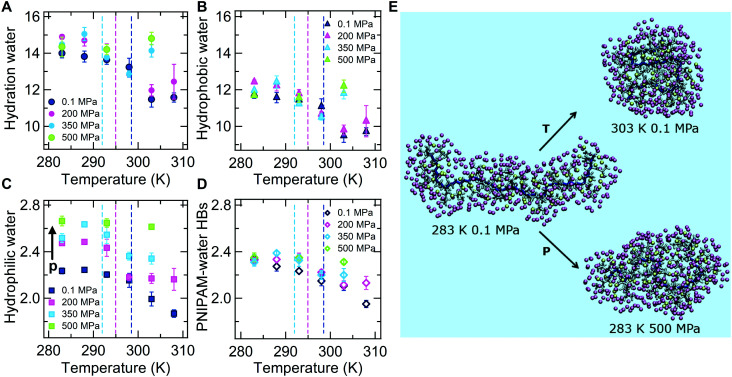
Fig. 2. Temperature dependence of (A) the number of hydration water molecules; (B) the number of hydrophobic water molecules; (C) the number of hydrophilic water molecules and (D) PNIPAM–water hydrogen bonds. Data calculated at pressure values of 0.1, 200, 350 and 500 MPa are shown in blue, pink, light blue and green, respectively. Numerical results are averaged over the last 100 ns of simulation and normalized to the number of repeating units. Vertical dashed lines mark the Tc values at 0.1 MPa (blue), 200 MPa (pink), and 350 MPa (light blue). (E) Snapshots of a coil state at low T and atmospheric pressure, a globule state at high T and atmospheric pressure, a hydrated globule-like state at low T and high pressure. PNIPAM atoms are shown in grey, with backbone carbons highlighted in blue. Oxygen atoms of hydration water are also displayed in pink and yellow when surrounding the hydrophobic and hydrophilic groups, respectively.

Fig. 2