. 2021 Feb 19;23(10):5984–5991. doi: 10.1039/d0cp06452a

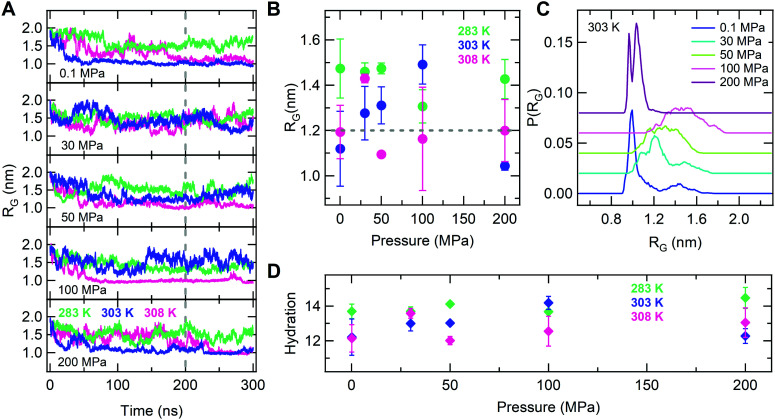
Fig. 3. Reentrant behavior at low pressures: (A) the radius of gyration as a function of time at P = 0.1, 30, 50, 100 and 200 MPa; (B) the average radius of gyration as a function of pressure calculated over the last 100 ns trajectory interval for two independent replicas at T = 283, 303 and 308 K. The dashed horizontal lines mark the critical value used to define collapsed conformations; (C) distribution of the radius of gyration P(RG) as a function of pressure at 303 K; (D) the number of hydration water molecules per PNIPAM residue as a function of pressure. Data refer to T = 283, 303 and 308 K. The analysis in C and D is also performed over the last 100 ns and averaged over two independent replicas.

Fig. 3