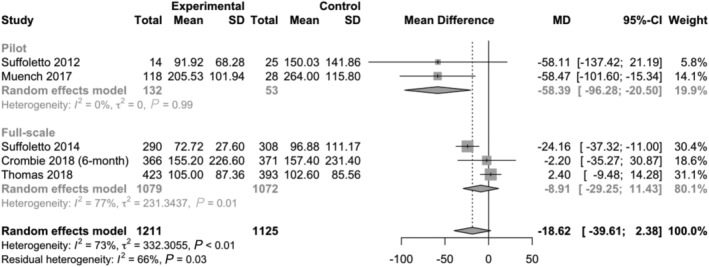
Figure 3.

Results from individual trials and overall effect estimate with respect to grams of alcohol per week. Primary planned analysis which includes the first post‐intervention follow‐up interval from each included trial (SD = standard deviation; MD = mean difference; CI = confidence interval). Stratified by pilot and full‐scale trials
