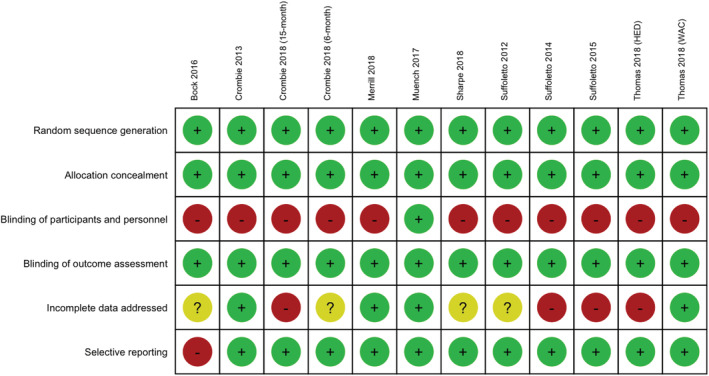
Figure 5.

Risk of bias plot: risk of bias broken down for each criterion and each included trial. [Colour figure can be viewed at wileyonlinelibrary.com]

Risk of bias plot: risk of bias broken down for each criterion and each included trial. [Colour figure can be viewed at wileyonlinelibrary.com]