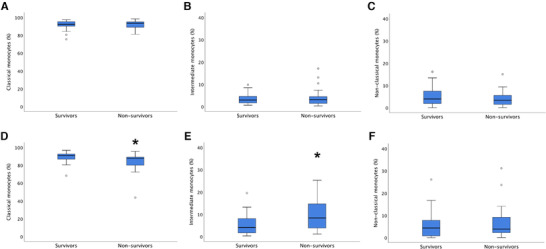
FIGURE 2.

Monocyte subset distribution and survival. (A–C) Monocyte subset distribution according to mortality upon admission. Given are percentages of total monocytes for classical monocytes (A), intermediate monocytes (B), and non‐classical monocytes (C) as obtained by flow cytometry. No differences in monocyte subset distribution according to survival status 6 months after cardiac arrest were seen. (D–F) Monocyte subset distribution according to mortality 72 h after admission. Given are percentages of total monocytes for classical monocytes (D), intermediate monocytes (E), and non‐classical monocytes (F) as obtained by flow cytometry. Patients dying within 6 months after suffering from a cardiac arrest were characterized by a significantly lower percentage of classical monocytes (D) and a significantly higher percentage of intermediate monocytes (E) 72 h after admission. * P < 0.05
