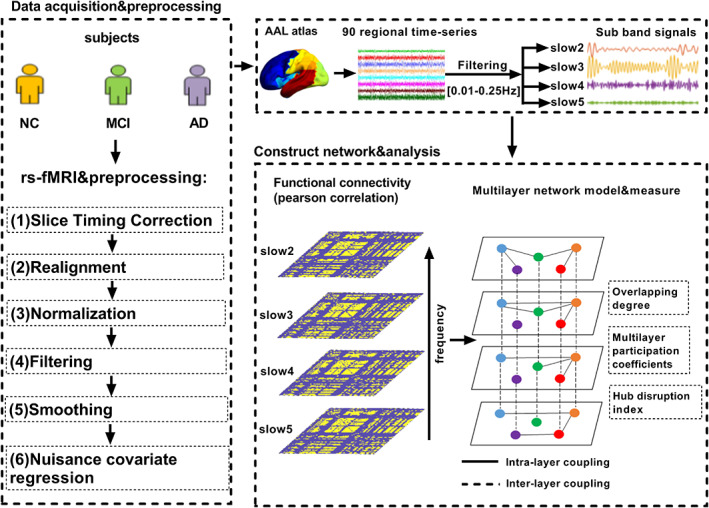
Figure 1.

The flow chart of the experiment. The results of fMRI data preprocessing were first divided into 90 brain regions using the existing standard brain profile of the AAL template. Each brain region represents a node in the network. The brain physiological signal is decomposed into four frequency segments, each frequency band used as a layer. The intralayer connection is calculated by Pearson correlation, and the same nodes are connected between layers (regardless of the cross‐frequency coupling between different brain regions). Finally, some multilayer network measures were calculated.
