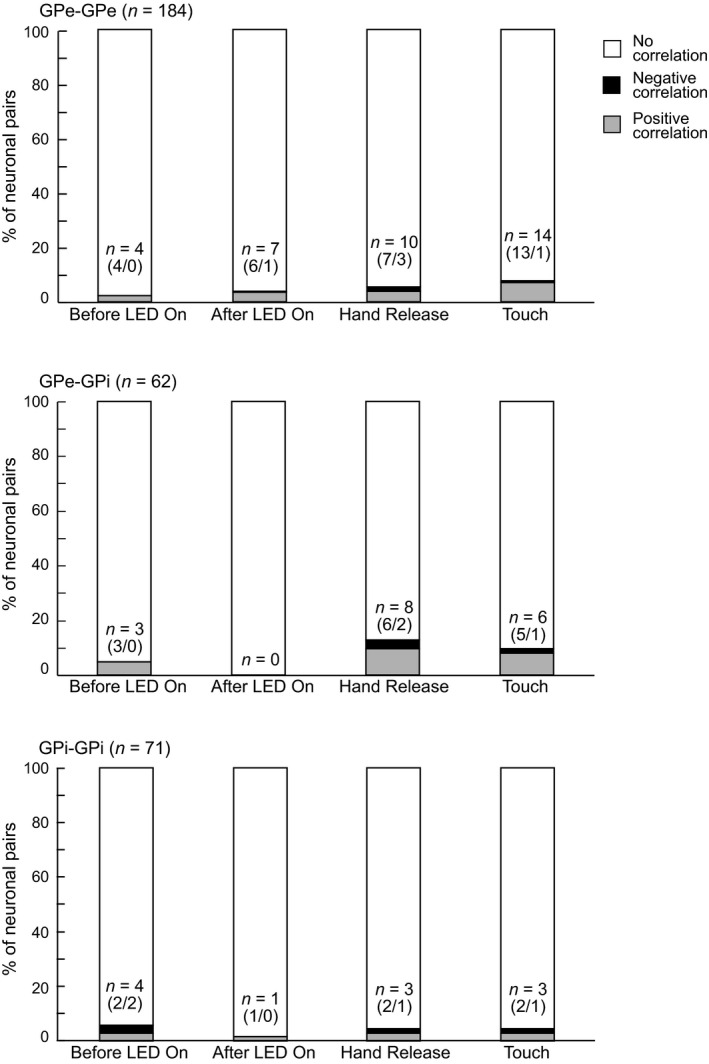
Figure 4.

Proportions of GPe/GPi neuronal pairs with significantly correlated activity during the task performance. Proportions of GPe‐GPe, GPe‐GPi and GPi‐GPi pairs with positive (gray), negative (black) and no (white) correlations are shown during the Before LED On, After LED On, Hand Release and Touch periods. n indicates the number of pairs with correlated activity in each period. Numbers in parentheses indicate number of pairs with positive correlations/ number of pairs with negative correlations
