
FIGURE 1.
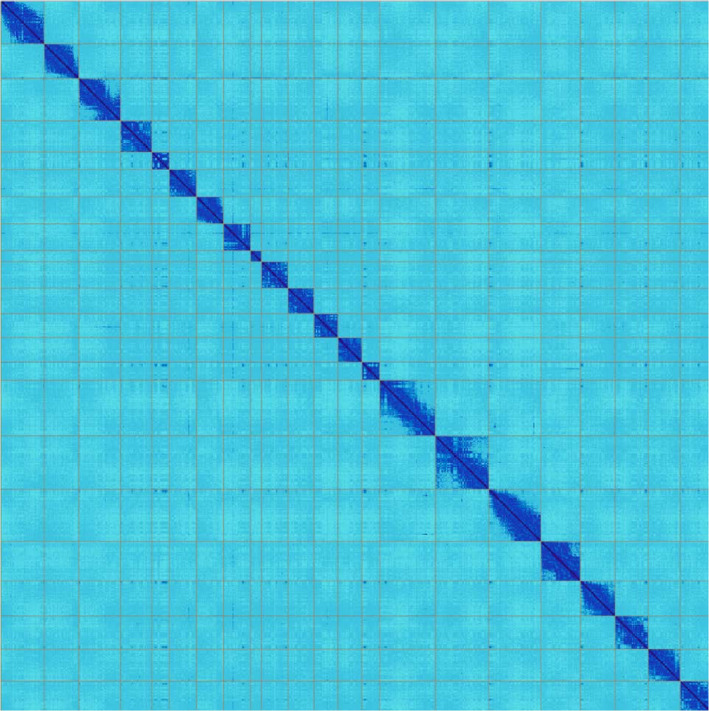
HiC heat‐map of genomic interactions. Interactions between two locations are depicted by a dark blue pixel. Grey lines depict scaffold boundaries for the 22 chromosome‐length scaffolds. Different scaffolds should not share any interactions (pixels off diagonal outside the scaffold boundaries), while patterns within a scaffold show chromosome‐substructure