
FIGURE 2.
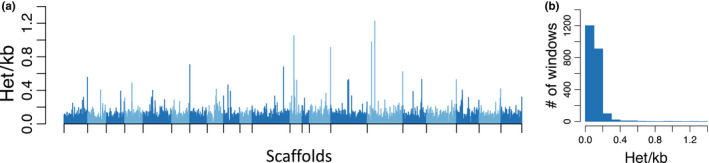
Distributions of heterozygosity across the vaquita genome. (a) Bar plot shows per‐site heterozygosity in nonoverlapping 1‐Mb windows across 21 autosomal scaffolds >10 Mb in length. Scaffolds are shown in alternating shades. Note that some of the highes peaks of heterozygosity are at the chromosme (scaffold) ends. (b) Histogram of the count of per‐window heterozygosity levels