Figure 4.
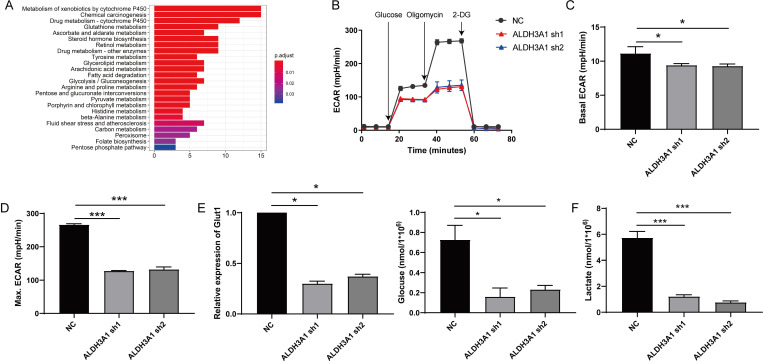
Tumor cell with low expression of ALDH3A1 exhibits poor glycolysis. (A) Different pathway analysis between low and high ALDH3A1 mRNA groups. (B) Seahorse assay for ECAR detection in A549 cell line transduced with ALDH3A1-sh1 and ALDH3A1-sh2. Basal ECAR (C), maximum ECAR (D), Glut1 expression, glucose consumption, (E) and lactate production (F) in NC, ALDH3A1-sh1 and ALDH3A1-sh2 cell lines. Data were expressed as mean ± SEM. *p < 0.05, ***p < 0.001.

