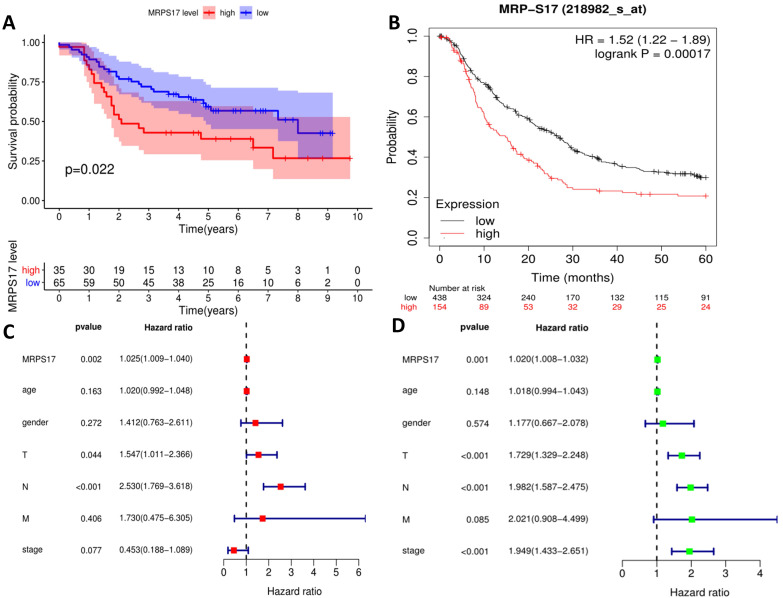
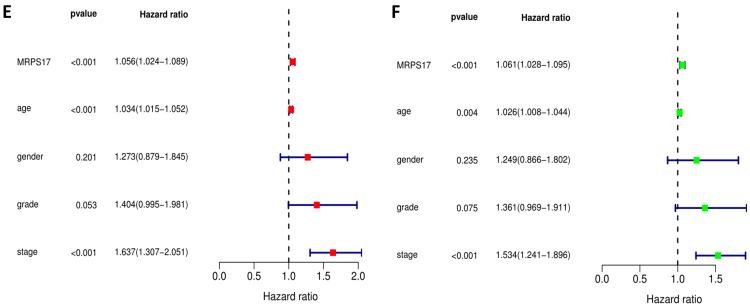
Figure 2.
Prognosis analysis of MRPS17. (A) The patient's survival prognosis in the database of our center. (B) Kaplan-Meier survival curves for MRPS17 in GEO database. The tick-marks on the curve represent the censored subjects. The number of patients at risk is listed below the curve. Univariate (green) and multivariate (red) COX regression analysis of different clinical parameters in our center (C-D) and TCGA (E-F) database.


