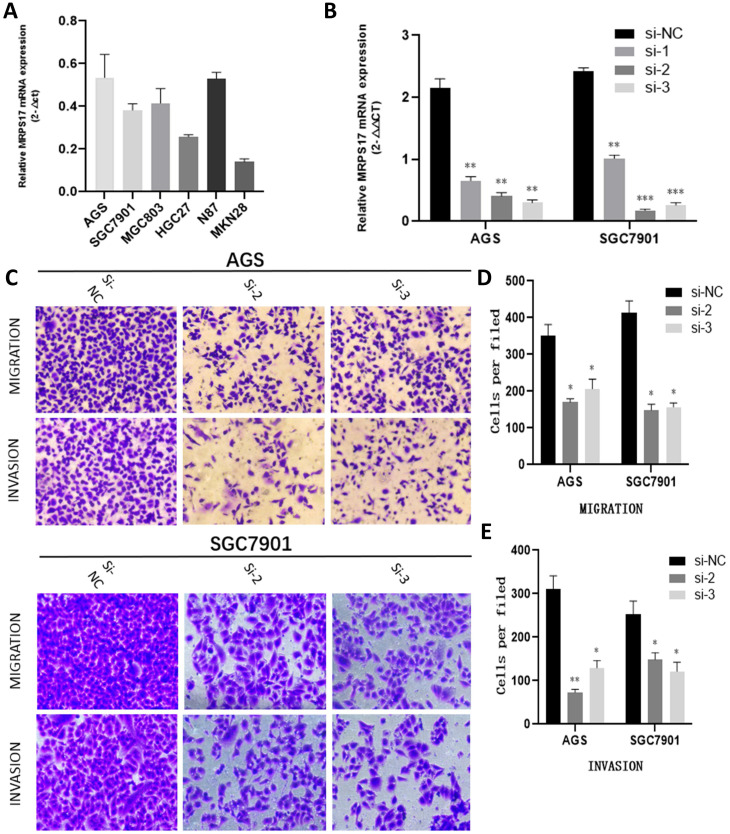
Figure 7.
(A) MRPS17 expression levels in AGS, SGC7901, MGC803, N87, HGC27, and MKN28 cells were determined by quantitative real-time PCR analyses. (B) MRPS17 expression levels in MPRS17-silenced cells and scrambled-siRNA-treated cells were evaluated by quantitative real-time PCR analyses. (C-E) Migration (upper C panel and D) and invasion (lower C panel and E) capabilities of AGS and MGC803 cells were assessed by Transwell assays after MRPS17 had been knocked down. Data were demonstrated as mean± standard deviation of triplicate determinations from three independent experiments. Statistical significance was assessed via the unpaired Student's t-test (two-tailed test). *P<0.05, **P<0.01 and ***P<0.001.

