
FIGURE 3.
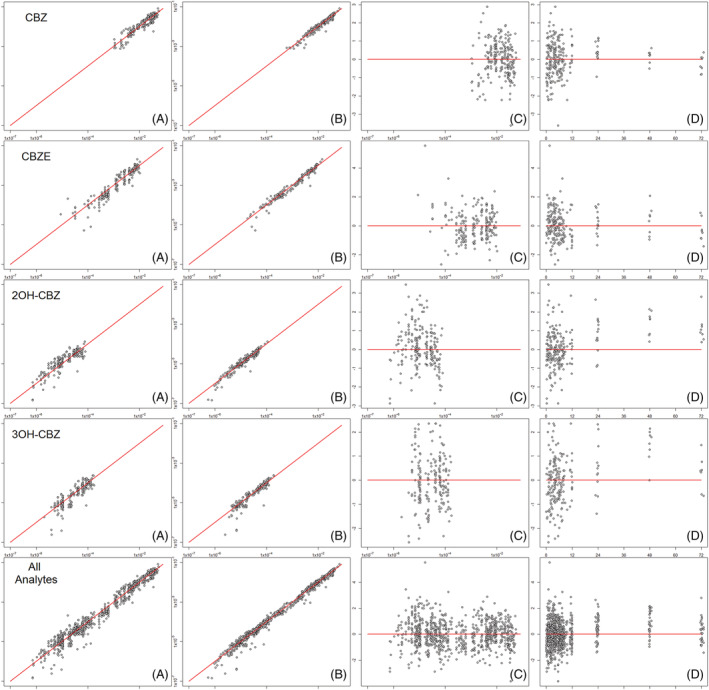
Goodness of fit diagnostic plots for of carbamazepine and metabolites (as labelled by row): (A) Observed concentrations (mM) vs population predicted concentrations (mM); (B) Observed concentrations (mM) vs individual predicted concentrations (mM); (C) Conditional weighted residuals vs population predicted concentrations (mM); (D) Conditional weighted residuals vs time after dose (h)