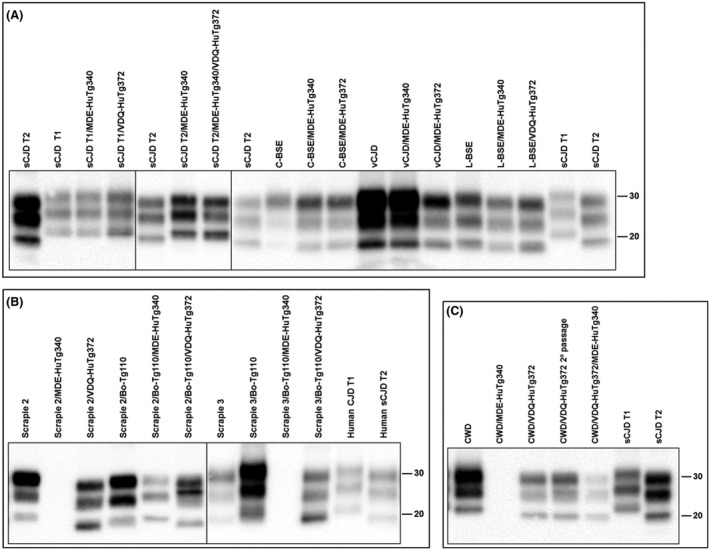
FIGURE 3.

Electrophoretic profiles of PrPres as detected by mAb Sha31 in brain extracts from mice infected with the prion agents indicated in the top. (A) Human and cattle inocula compared with the positive transmissions in MDE‐HuTg340 and VDQ‐HuTg372 transgenic mice. (B) Sheep and sheep‐derived inocula compared with the transmissions in MDE‐HuTg340 and VDQ‐HuTg372 transgenic mice. (C) Elk inoculum compared with the transmissions in MDE‐HuTg340 and VDQ‐HuTg372 transgenic mice. T1 and T2 sCJD from human brain have been included as controls for better comparison. Similar quantities of PrPres were loaded in each lane for better comparison. Molecular mass (in kD) is shown at the right side of the blots
