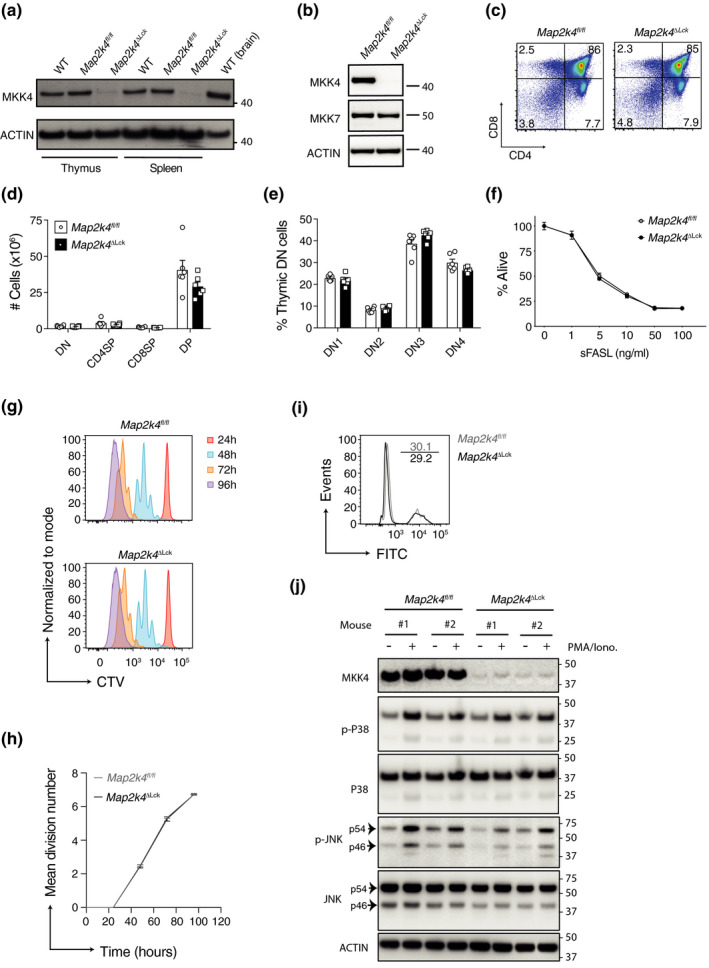
Figure 1.

T‐cell development and proliferation occur normally in the absence of MKK4. (a) Immunoblot analysis of MKK4 and ACTIN (loading control) expression in thymocytes (thymus) or flow cytometry sorted splenic CD8+ T cells (spleen). WT (brain) is a positive control. (b) Immunoblot analysis of MKK4 and MKK7 expression in flow cytometry sorted splenic CD8+ T cells. Numbers to the right of the panels represent position of protein size markers (kDa). (c) Representative flow cytometry plots showing thymocytes stained for CD4 and CD8. Percentages of thymocytes in quadrants are indicated. (d) Numbers of each of the thymocyte populations from c. (e) Proportions of DN (double negative; CD4−CD8−) thymocytes at each of the four stages of negative selection. (f) Total thymocytes cultured with oligomerized soluble FasL (sFasL) for 24 h. The mean proportion (± SEM) of thymocytes that are alive, relative to unstimulated, are shown (n = 4 or 5 mice). (g) Representative flow cytometry histograms, illustrating the division of naïve CD8+ T cells sorted using magnetic beads, labeled with CTV and cultured with anti‐CD3 and anti‐CD28 antibodies for 1–4 days (24–96 h). (h) Mean division number at each of the timepoints from experiment in g (n = 3). (i) Naïve CD8+ T cells stained with a fluorescent (FITC) live/dead dye, following 3 days in culture as in g. (j) Immunoblot analysis of cell lysates from magnetically sorted CD8+ T cells that were either left unstimulated or stimulated for 15 min with PMA and ionomycin. Numbers to the right of the panels represent position of protein size markers (kDa). CTV, cell trace violet; h, hours; Iono, Ionomycin; CD4SP, CD4+CD8−; CD8SP, CD4−CD8+; DP, CD4+CD8+; DN1, CD44+CD25−; DN2, CD44+CD25+; DN3, CD44−CD25+; DN4, CD44−CD25−. All experiments were performed at least twice. Graphs show mean and SEM. Each symbol represents one mouse.
