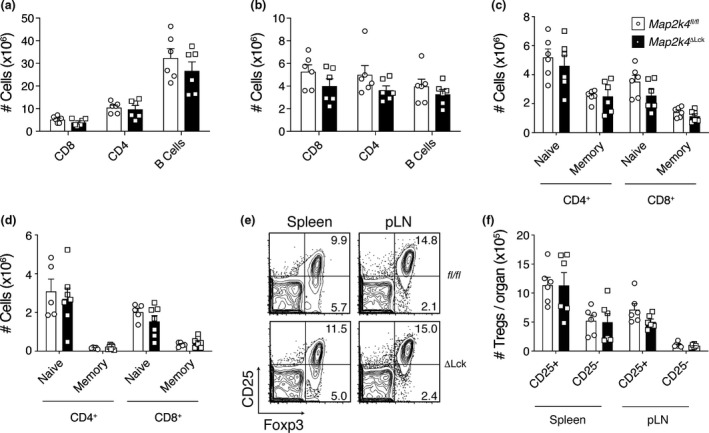
Figure 2.

Effect of MKK4 loss on peripheral lymphoid compartments. Numbers of B and T cells in the (a) spleen and (b) pLN. (c, d) Numbers of naïve and memory T cells in the spleen (c) and pLN (d) of naïve animals. (e) Representative flow cytometry plots indicating the proportion of Tregs, gated on CD4+. Percentages of Tregs are indicated in the relevant quadrants. (f) Numbers of CD25− and CD25+ Tregs in the spleen and pLN from the same experiment as in e (n = 6). Graphs show mean and SEM. Data are representative of three independent experiments (a–e) or combined from two independent experiments (f). Each symbol represents one mouse.
