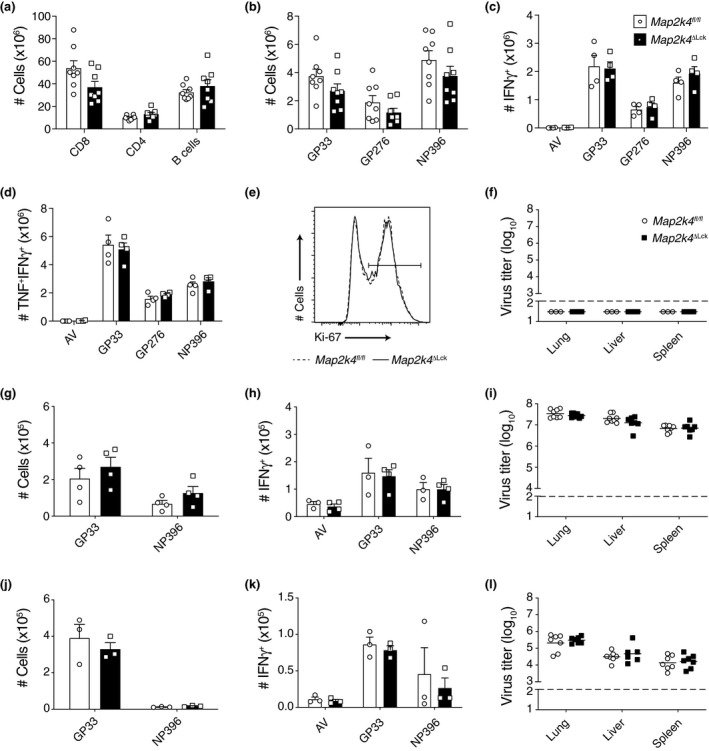
Figure 3.

Loss of MKK4 does not perturb the response to viral infection. (a–e) Data generated from animals 8 days post infection with LCMV Armstrong (acute). (a) Numbers of lymphocytes isolated from the spleens of the indicated mice. (b) Numbers of LCMV‐specific CD8+ T cells identified using the relevant tetramers. (c, d) Ex vivo cytokine production by LCMV‐specific CD8+ T cells. Total splenocytes were restimulated with control adenoviral peptide (AV) or the indicated recombinant cognate LCMV peptides. Numbers of CD8+ T cells producing the indicated cytokines after stimulation with the indicated peptides are shown. (e) Representative flow cytometry histogram showing the proportion of ex vivo CD8+ T cells that have recently divided (proliferation). Gated on CD8+. (f) Virus titers in the indicated organs of mice 7 days post infection with LCMV Armstrong. (g–i) Data generated from animals 8 days post infection with LCMV Docile (chronic). (g) Numbers of LCMV‐specific CD8+ T cells identified using the relevant tetramers. (h) Ex vivo cytokine production performed as in c and d. (i) Virus titers in the indicated organs of mice 8 days post infection with LCMV Docile. (j–l) Data generated from animals 35 days post infection with LCMV Docile (chronic). (j) Numbers of LCMV‐specific CD8+ T cells identified using the relevant tetramers. (k) Ex vivo cytokine production performed as in c and d. (l) Virus titers in the indicated organs of mice 35 days post infection with LCMV Docile. Data are pooled from two independent experiments (a, b, i, l) or representative of two independent experiments (c, d, g, h, j, k). Bar graphs show mean and SEM. Viral titers graphs show geometric mean as a horizontal line in each group. The dotted line represents the limit of detection for the viral titer assay. Each symbol represents one mouse.
