Figure 1.

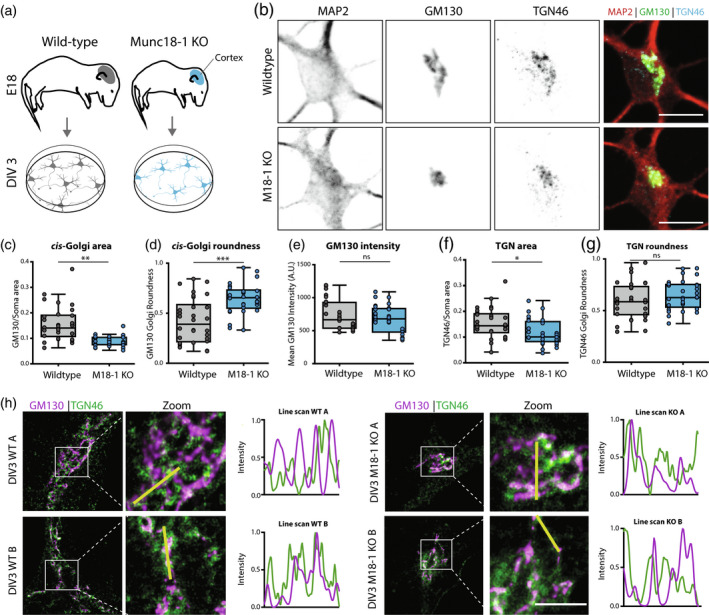
Munc18‐1 KO neurons have a smaller cis and trans Golgi complex. (a) Cortical neurons from E18 WT and Munc18‐1 KO mice were plated on glia feeder layers. At DIV3, cultures were fixed and stained for Golgi markers. (b) Typical example of WT and Munc18‐1 KO neurons, stained for MAP2 (dendritic marker), GM130 (cis‐Golgi marker) and TGN46 (TGN marker). Scale bar is 10μm. (c) The GM130‐positive area was 33% smaller in Munc18‐1 KO neurons compared to WT neurons (p < .0001, Mann–Whitney U test). N: WT = 28/3, KO = 30/3. (d) The GM130‐positive area of Munc18‐1 KO neurons was 50% rounder (p = .0001, Mann–Whitney U test). N: WT = 28/3, KO = 30/3. (e) Average intensity of GM130 was comparable between Munc18‐1 KO and WT controls (ns p = .27, unpaired T test). N: WT = 28/3, KO = 30/3. (f) Munc18‐1 KO neurons presented a 30% smaller TGN compared to WT neurons (p = .01, unpaired T test). N: WT = 30/3, KO = 29/3. (g) TGN roundness is not affected in Munc18‐1 KO neurons (ns p = .22, Mann–Whitney U test). N: WT = 30/3, KO = 29/3. (h) Representative STED images and intensity line scans of DIV 3 WT and Munc18‐1 KO neurons, stained for GM130 (cis‐Golgi marker) and TGN46 (TGN marker). Scale bar is 2μm. Data is represented in Tukey boxplots. Columns and dots represent individual litters and neurons, respectively. N = number of neurons/number of independent cell cultures
