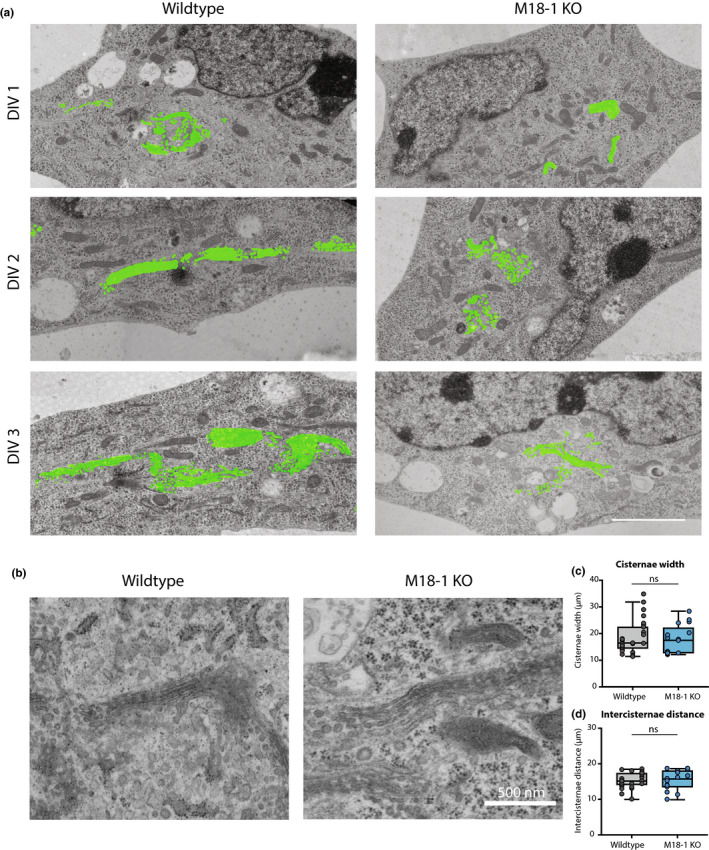
Figure 2.

Less Golgi membrane, but normal cisternae structure in Munc18‐1 KO neurons. (a) Typical examples of EM images of WT and Munc18‐1 KO neurons fixed at DIV 1, 2 and 3. Golgi membrane is highlighted in green. Scale bar 2.5μm. (b) High magnification EM images of Golgi apparatus in WT and Munc18‐1 KO neurons at DIV 3. Scale bar 500 nm. (c) Average width of Golgi cisternae was not different between WT and Munc18‐1 KO neurons (ns p = .49, Mann–Whitney U test). N: WT = 29/3, KO = 17/3. (d) Munc18‐1 KO neurons did not differ in distance between cisternae (ns p = .97, unpaired T test). N: WT = 29/3, KO = 17/2. Mean and individual neurons as dots are shown. N = number of neurons/number of independent cell cultures
