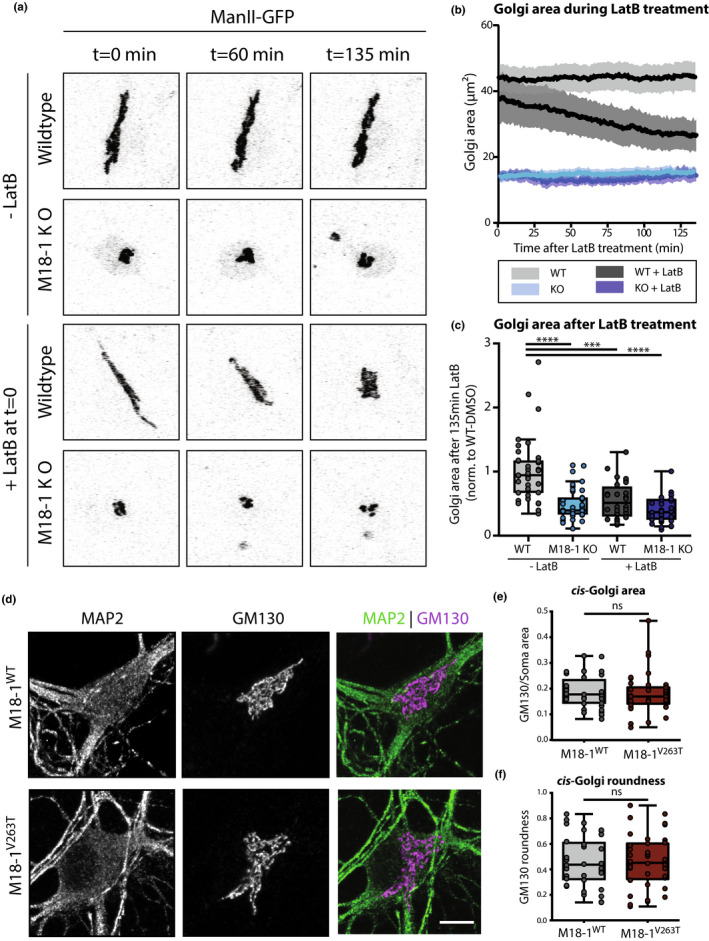
Figure 3.

Actin depolymerization reduces Golgi area in WT but not in Munc18‐1 KO neurons. (a) WT and Munc18‐1 KO neurons were infected with ManII‐GFP (Golgi marker) and treated with LatB at DIV3. Golgi morphology was imaged for 135 min. (b) Golgi area in WT and Munc18‐1 KO neurons with and without LatB treatment over time. (c) Average Golgi area in WT and Munc18‐1 KO neurons with and without LatB treatment after 135 min of treatment. Data were normalized to the respective batch average of WT‐DMSO condition. The groups were significantly different from each other (p < .0001, Kruskal–Wallis test). Post hoc multiple comparisons revealed that WT Golgi area was significantly larger than untreated Munc18‐1 KO, LatB‐treated WT and LatB‐treated KO neurons, whereas these latter groups were not significantly different from each other ( post‐hoc Dunn's comparisons test). N: WT + DMSO=37/3, KO + DMSO=40/3, WT + LatB=28/3, KO + LatB=32/3. (d) Typical examples of Munc18‐1 KO neurons rescued with M18‐1WT and M18‐1V263T at DIV14 stained for MAP2 (dendritic marker) and GM130 (cis‐Golgi marker). Scale bar is 10 μm. (e) GM130‐positive area in M18‐1V263T was not different from M18‐1WT neurons (ns p = .51, Mann–Whitney U test). N: WT = 36/3, KO = 40/3. (f) GM130‐positive area roundness was not affected in M18‐1V263T neurons (ns p = .87, Mann–Whitney test). (g) N: WT = 36/3, KO = 40/3. (h) Data is represented in Tukey boxplots. Columns and dots represent individual litters and neurons, respectively. N = number of neurons/number of independent cell cultures
