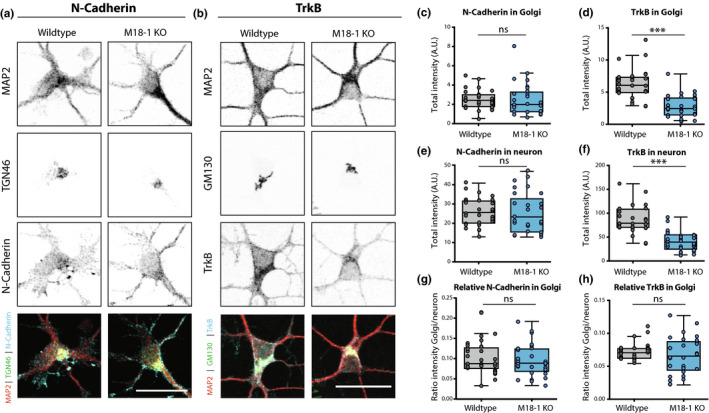
Figure 4.

Endogenous markers of the secretory pathway do not accumulate in the Golgi of Munc18‐1 KO neurons. (a) Typical example of WT and Munc18‐1 KO neurons at DIV3 stained for MAP2 (dendritic marker), TGN46 (Trans Golgi Network Marker) and N‐Cadherin. Scale bar is 25μm. (b) Typical example of WT and Munc18‐1 KO neurons at DIV3 stained for MAP2 (dendritic marker), GM130 (cis‐Golgi marker) and TrkB. Scale bar is 25μm. (c) N‐Cadherin intensity in Golgi was not different between WT and Munc18‐1 KO (ns p = .24, Mann–Whitney test). N: WT = 30/3, KO = 29/3. (d) TrkB intensity in Golgi was ~55% lower in Munc18‐1 KO (p < .0001, Mann–Whitney test). N: WT = 28/3, KO = 30/3. (e) Munc18‐1 KO neurons did not differ in total N‐Cadherin intensity (ns p = .82, unpaired T test). N: WT = 30/3, KO = 29/3. (f) Total TrkB intensity in Munc18‐1 KO neurons was ~55% lower (p < .0001, unpaired T test). N: WT = 28/3, KO = 30/3. (g) Relative N‐Cadherin distribution in the Golgi, measured by N‐Cadherin intensity in Golgi (c) divided by total N‐Cadherin intensity (e), was not different in Munc18‐1 KO neurons (ns p = .65, Mann–Whitney test). N: WT = 30/3, KO = 29/3. (h) Relative TrkB distribution in the Golgi, measured by TrkB intensity in Golgi (d) divided by total TrkB intensity (f), was not different in Munc18‐1 KO neurons (ns p = .36, Mann–Whitney test). N: WT = 28/3, KO = 30/3. Data is represented in Tukey boxplots. Columns and dots represent individual litters and neurons, respectively. N = number of neurons/number of independent cell cultures
